
Smith chart
scikit-rf ring-slot resonator, W-band 75–110 GHz
Example from the compendium of canonical charts
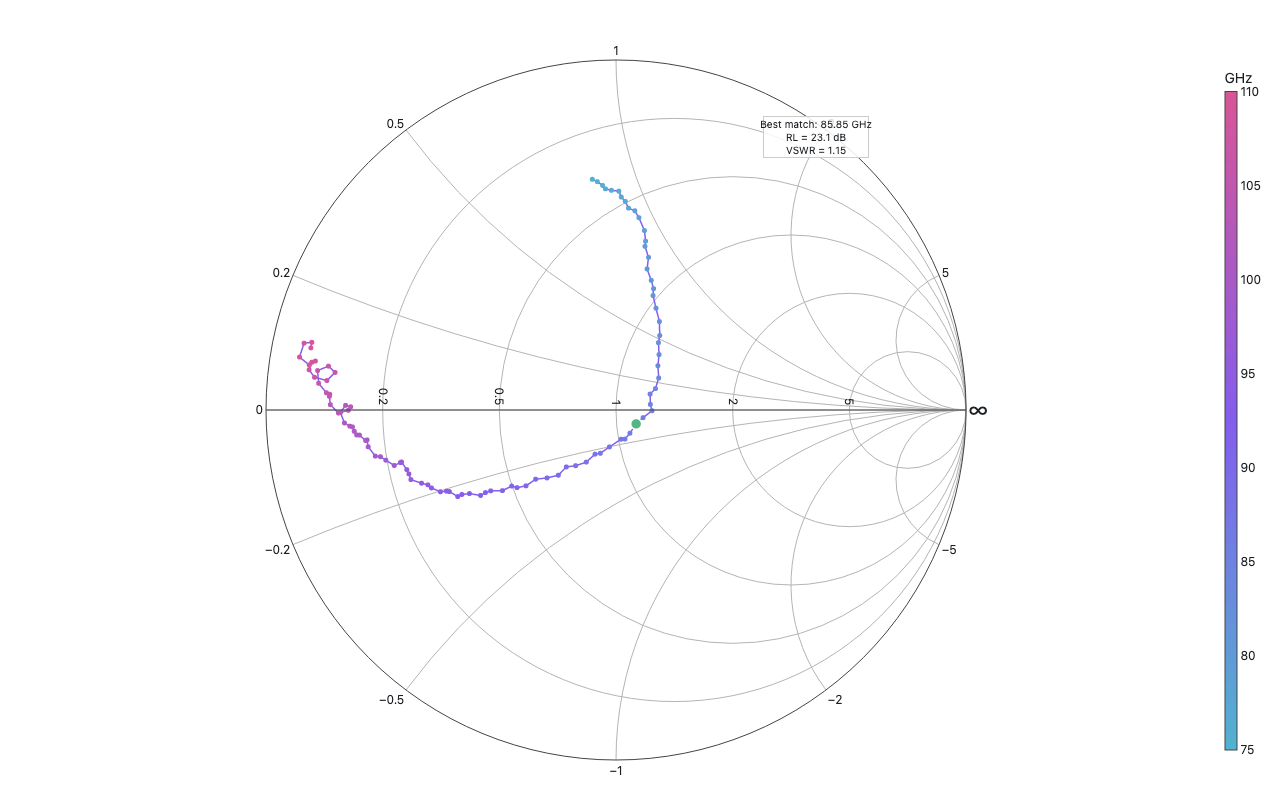
Python Code
"""Smith chart — scikit-rf ring-slot resonator, W-band 75–110 GHz."""
from pathlib import Path

# ── Palette + theme (matching the Plotly Studio gallery these charts ship in) ──
VIOLET, TEAL, GREEN, PINK, ORANGE = "#845EEE", "#52B3D0", "#55B685", "#DA5597", "#E9A23B"
PRIMARY, SECONDARY = VIOLET, TEAL
COLORWAY = [VIOLET, TEAL, GREEN, PINK, ORANGE]
BG, TEXT, GRID, MUTED = "#ffffff", "#1c2024", "#d9d9e0", "#60646c"
FONT = "Inter, -apple-system, BlinkMacSystemFont, sans-serif"
COLORSCALE = [[0, "rgba(132, 94, 238, 0.05)"], [1, "rgba(132, 94, 238, 0.9)"]]


def apply_theme(fig):
    """Light gallery theme: white background, Inter font, soft gridlines."""
    fig.update_layout(
        paper_bgcolor=BG, plot_bgcolor=BG, colorway=COLORWAY,
        font=dict(family=FONT, color=TEXT, size=12),
        legend=dict(font=dict(color=TEXT)),
        hoverlabel=dict(bgcolor="#f0f0f3", font=dict(color=TEXT, family=FONT), bordercolor=GRID),
    )
    fig.update_xaxes(gridcolor=GRID, linecolor=GRID, zerolinecolor=GRID)
    fig.update_yaxes(gridcolor=GRID, linecolor=GRID, zerolinecolor=GRID)


def fetch_csv(url, **kwargs):
    import io
    import pandas as pd
    import requests
    r = requests.get(url, timeout=60)
    r.raise_for_status()
    return pd.read_csv(io.StringIO(r.text), **kwargs)


def fetch_json(url):
    import requests
    r = requests.get(url, timeout=60)
    r.raise_for_status()
    return r.json()

import numpy as np
import pandas as pd
import plotly.graph_objects as go
import requests, warnings, io

URL = "https://raw.githubusercontent.com/scikit-rf/scikit-rf/master/skrf/data/ring%20slot%20measured.s1p"


def parse_s1p(text):
    """Parse Touchstone S1P: skip ! and # comment lines, read freq Re Im."""
    rows = []
    for line in text.splitlines():
        line = line.strip()
        if not line or line.startswith("!") or line.startswith("#"):
            continue
        parts = line.split()
        if len(parts) >= 3:
            try:
                rows.append([float(p) for p in parts[:3]])
            except ValueError:
                pass
    return pd.DataFrame(rows, columns=["freq_ghz", "re", "im"])


def generate():
    print("fetching ring-slot resonator S1P …")
    warnings.filterwarnings("ignore")
    requests.packages.urllib3.disable_warnings()
    r = requests.get(URL, verify=False, timeout=30)
    r.raise_for_status()
    df = parse_s1p(r.text)
    print(f"  {len(df)} frequency points, {df['freq_ghz'].min():.1f}–{df['freq_ghz'].max():.1f} GHz")

    # S1P RI format: re + j*im are reflection coefficient Γ
    # Clip to unit circle: passive devices have |Γ| ≤ 1
    gamma = df["re"].values + 1j * df["im"].values
    mag   = np.abs(gamma)
    mask  = mag <= 1.0
    gamma = gamma[mask]
    mag   = mag[mask]
    df    = df[mask].copy().reset_index(drop=True)
    print(f"  {len(df)} points inside unit disk")

    # Convert Γ → normalized impedance Z = (1 + Γ) / (1 - Γ)
    # go.Scattersmith expects Z (real, imag), not Γ
    denom = 1 - gamma
    denom[np.abs(denom) < 1e-9] = 1e-9   # avoid division by zero at Γ=1
    z = (1 + gamma) / denom
    df["z_re"] = z.real
    df["z_im"] = z.imag

    # Find best match (minimum |S11|)
    best_idx  = np.argmin(mag)
    best_freq = df.loc[best_idx, "freq_ghz"]
    best_mag  = float(mag[best_idx])
    return_loss = -20 * np.log10(best_mag + 1e-9)
    vswr = (1 + best_mag) / max(1 - best_mag, 1e-9)

    print(f"  best match: {best_freq:.2f} GHz, |S11|={best_mag:.3f}, RL={return_loss:.1f}dB, VSWR={vswr:.2f}")

    fig = go.Figure(go.Scattersmith(
        real=df["z_re"],
        imag=df["z_im"],
        mode="markers+lines",
        marker=dict(
            color=df["freq_ghz"],
            colorscale=[[0, TEAL], [0.5, VIOLET], [1, PINK]],
            size=5,
            colorbar=dict(title="GHz", thickness=12),
            showscale=True,
        ),
        line=dict(color=VIOLET, width=1.5),
        text=[f"{f:.2f} GHz" for f in df["freq_ghz"]],
        hovertemplate="%{text}<br>Re=%{real:.3f}, Im=%{imag:.3f}<extra></extra>",
        showlegend=False,
    ))

    # Highlight the best-match point in a contrasting colour (green against the
    # cyan→violet→pink frequency scale) so the annotation has a visible referent.
    fig.add_trace(go.Scattersmith(
        real=[df.loc[best_idx, "z_re"]],
        imag=[df.loc[best_idx, "z_im"]],
        mode="markers",
        marker=dict(color=GREEN, size=11, line=dict(color="white", width=1.5)),
        showlegend=False,
        text=[f"{best_freq:.2f} GHz"],
        hovertemplate="Best match — %{text}<br>Re=%{real:.3f}, Im=%{imag:.3f}<extra></extra>",
    ))

    fig.add_annotation(
        x=0.72, y=0.92, xref="paper", yref="paper", xanchor="right", yanchor="top",
        text=f"Best match: {best_freq:.2f} GHz<br>RL = {return_loss:.1f} dB<br>VSWR = {vswr:.2f}",
        showarrow=False,
        bgcolor="rgba(255,255,255,0.85)",
        bordercolor="#ccc",
        font=dict(size=10),
    )

    fig.update_layout(
        title=dict(text="Smith Chart — Ring-Slot Resonator, W-band (75–110 GHz)", x=0.5),
        margin=dict(t=60, b=40, l=40, r=80),
        height=500,
    )
    apply_theme(fig)
    return fig


fig = generate()
fig.show()
Made with Plotly