
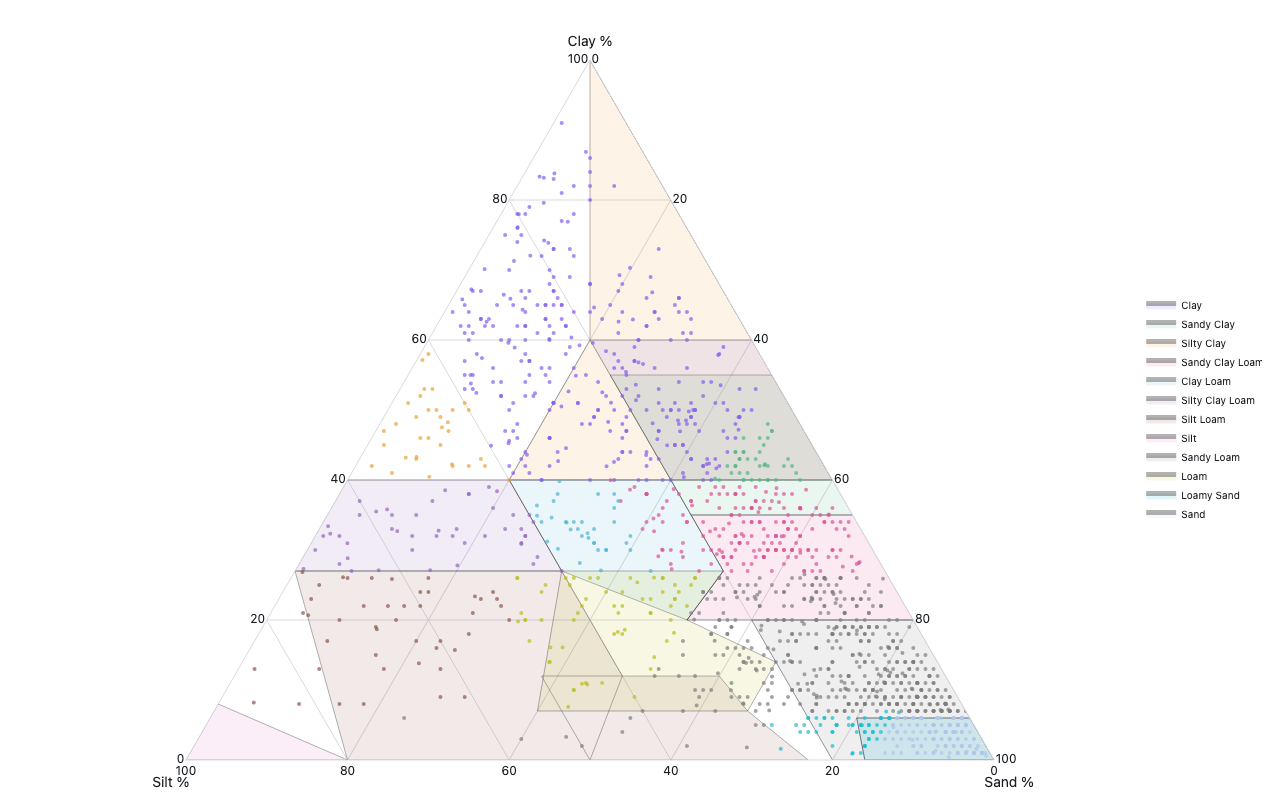
USDA soil texture triangle
ISRIC WoSIS topsoil data with class overlays
Example from the compendium of canonical charts
Python Code
"""USDA soil texture triangle — ISRIC WoSIS topsoil data with class overlays."""
from pathlib import Path

# ── Palette + theme (matching the Plotly Studio gallery these charts ship in) ──
VIOLET, TEAL, GREEN, PINK, ORANGE = "#845EEE", "#52B3D0", "#55B685", "#DA5597", "#E9A23B"
PRIMARY, SECONDARY = VIOLET, TEAL
COLORWAY = [VIOLET, TEAL, GREEN, PINK, ORANGE]
BG, TEXT, GRID, MUTED = "#ffffff", "#1c2024", "#d9d9e0", "#60646c"
FONT = "Inter, -apple-system, BlinkMacSystemFont, sans-serif"
COLORSCALE = [[0, "rgba(132, 94, 238, 0.05)"], [1, "rgba(132, 94, 238, 0.9)"]]


def apply_theme(fig):
    """Light gallery theme: white background, Inter font, soft gridlines."""
    fig.update_layout(
        paper_bgcolor=BG, plot_bgcolor=BG, colorway=COLORWAY,
        font=dict(family=FONT, color=TEXT, size=12),
        legend=dict(font=dict(color=TEXT)),
        hoverlabel=dict(bgcolor="#f0f0f3", font=dict(color=TEXT, family=FONT), bordercolor=GRID),
    )
    fig.update_xaxes(gridcolor=GRID, linecolor=GRID, zerolinecolor=GRID)
    fig.update_yaxes(gridcolor=GRID, linecolor=GRID, zerolinecolor=GRID)


def fetch_csv(url, **kwargs):
    import io
    import pandas as pd
    import requests
    r = requests.get(url, timeout=60)
    r.raise_for_status()
    return pd.read_csv(io.StringIO(r.text), **kwargs)


def fetch_json(url):
    import requests
    r = requests.get(url, timeout=60)
    r.raise_for_status()
    return r.json()

import io
import numpy as np
import pandas as pd
import plotly.graph_objects as go
import requests, warnings

URL = "https://raw.githubusercontent.com/bgmartins/soil-classification/master/data/all.csv"

# ── USDA texture class boundary polygons (clay%, silt%, sand%) ───────────────
# Hard-coded canonical USDA.TT vertices (clay=top, silt=right, sand=left)
# Each class is a list of (clay, silt, sand) tuples in ternary coordinates
# Source: R soiltexture package USDA.TT
USDA_CLASSES = {
    "Clay":         [(100,0,0),(40,0,60),(40,20,40),(60,20,20),(60,0,40)],
    "Sandy Clay":   [(35,0,65),(35,20,45),(55,20,25),(55,0,45)],
    "Silty Clay":   [(40,60,0),(40,40,20),(60,20,20),(60,0,40),(100,0,0)],
    "Sandy Clay\nLoam": [(20,0,80),(20,28,52),(35,20,45),(35,0,65)],
    "Clay Loam":    [(27,20,53),(27,40,33),(40,40,20),(40,20,40),(35,20,45),(35,0,65),(20,0,80),(20,28,52)],
    "Silty Clay\nLoam": [(27,40,33),(27,73,0),(40,60,0),(40,40,20)],
    "Silt Loam":    [(0,80,20),(0,100,0),(27,73,0),(27,40,33),(12,40,48),(12,50,38)],
    "Silt":         [(0,100,0),(0,87,13),(8,92,0)],  # small class, simplified
    "Sandy Loam":   [(0,0,100),(0,20,80),(14,20,66),(20,20,60),(20,28,52),(20,0,80)],
    "Loam":         [(7,27,66),(7,53,40),(27,40,33),(27,20,53),(20,28,52),(14,20,66),(0,20,80)],
    "Loamy Sand":   [(0,0,100),(0,16,84),(6,14,80),(6,0,94)],
    "Sand":         [(0,0,100),(0,16,84),(6,14,80),(6,0,94)],
}

# Simplified but correct USDA boundary polygons for clean rendering
USDA_POLYGONS = {
    "Clay":          [(60,20,20),(60,0,40),(100,0,0),(40,0,60),(40,20,40)],
    "Sandy Clay":    [(35,0,65),(55,0,45),(55,20,25),(35,20,45)],
    "Silty Clay":    [(40,40,20),(60,20,20),(100,0,0),(40,0,60),(40,20,40)], # approx
    "Sandy Clay Loam":[(20,0,80),(35,0,65),(35,20,45),(27,20,53),(20,28,52)],
    "Clay Loam":     [(27,20,53),(40,20,40),(40,40,20),(27,40,33),(20,28,52)],  # approx
    "Silty Clay Loam":[(27,40,33),(40,40,20),(40,60,0),(27,73,0)],
    "Silt Loam":     [(0,50,50),(12,50,38),(12,28,60),(7,27,66),(0,23,77),(0,80,20),(27,73,0),(27,40,33),(12,40,48)],
    "Silt":          [(0,80,20),(0,100,0),(8,92,0)],
    "Sandy Loam":    [(0,0,100),(0,20,80),(20,20,60),(20,0,80)],
    "Loam":          [(7,27,66),(7,53,40),(27,40,33),(27,20,53),(20,28,52),(14,20,66)],
    "Loamy Sand":    [(0,0,100),(0,16,84),(6,14,80),(6,0,94)],
    "Sand":          [(0,0,100),(0,16,84),(6,14,80),(6,0,94)],
}

# 12 distinct colors for texture classes
CLASS_COLORS = [
    "#845EEE","#55B685","#E9A23B","#DA5597","#52B3D0",
    "#9467bd","#8c564b","#e377c2","#7f7f7f","#bcbd22","#17becf","#aec7e8"
]
CLASS_LIST = list(USDA_POLYGONS.keys())
CLASS_COLOR_MAP = {c: CLASS_COLORS[i % len(CLASS_COLORS)] for i, c in enumerate(CLASS_LIST)}


def classify_usda(clay, silt, sand):
    """Simple USDA texture classification."""
    if clay >= 40:
        if silt >= 40:
            return "Silty Clay"
        elif sand <= 45:
            return "Clay"
        else:
            return "Sandy Clay"
    elif clay >= 27:
        if sand >= 20 and silt < 28:
            return "Sandy Clay Loam"
        elif silt >= 40:
            return "Silty Clay Loam"
        else:
            return "Clay Loam"
    elif clay >= 7:
        if silt >= 50:
            return "Silt Loam"
        elif sand >= 52:
            return "Sandy Loam"
        else:
            return "Loam"
    else:
        if silt >= 80:
            return "Silt"
        elif sand >= 85:
            return "Sand"
        elif sand >= 70:
            return "Loamy Sand"
        else:
            return "Sandy Loam"


def generate():
    print("fetching WoSIS topsoil sand/silt/clay (streaming first ~3 MB) …")
    warnings.filterwarnings("ignore")
    requests.packages.urllib3.disable_warnings()

    # Stream first 3MB to get ~18k rows without downloading 30MB
    r = requests.get(URL, verify=False, timeout=60, stream=True,
                     headers={"Range": "bytes=0-3000000"})
    raw = b""
    for chunk in r.iter_content(65536):
        raw += chunk
        if len(raw) >= 3_000_000:
            break

    text = raw.decode("utf-8", errors="ignore")
    # Trim last partial line
    text = text[:text.rfind("\n")]

    df = pd.read_csv(io.StringIO(text), low_memory=False)
    print(f"  raw rows: {len(df)}, columns sample: {list(df.columns[:8])}")

    # Find sand/silt/clay columns (flexible naming)
    sand_col = next((c for c in df.columns if "sand" in c.lower() and "avg" in c.lower()), None)
    silt_col = next((c for c in df.columns if "silt" in c.lower() and "avg" in c.lower()), None)
    clay_col = next((c for c in df.columns if "clay" in c.lower() and "avg" in c.lower()), None)

    if not all([sand_col, silt_col, clay_col]):
        # Try simpler names
        sand_col = next((c for c in df.columns if "sand" in c.lower()), None)
        silt_col = next((c for c in df.columns if "silt" in c.lower()), None)
        clay_col = next((c for c in df.columns if "clay" in c.lower()), None)

    print(f"  columns: sand={sand_col}, silt={silt_col}, clay={clay_col}")

    df = df.dropna(subset=[sand_col, silt_col, clay_col]).copy()
    df["sand"] = pd.to_numeric(df[sand_col], errors="coerce")
    df["silt"] = pd.to_numeric(df[silt_col], errors="coerce")
    df["clay"] = pd.to_numeric(df[clay_col], errors="coerce")
    df = df.dropna(subset=["sand","silt","clay"])

    # Normalize rows to 100
    total = df["sand"] + df["silt"] + df["clay"]
    df = df[total > 5].copy()
    total = total[total > 5]
    df["sand"] = df["sand"] / total * 100
    df["silt"] = df["silt"] / total * 100
    df["clay"] = df["clay"] / total * 100

    # Classify and subsample
    df["class"] = df.apply(lambda r: classify_usda(r["clay"], r["silt"], r["sand"]), axis=1)
    df = df.sample(n=min(1500, len(df)), random_state=42)
    print(f"  after filter+subsample: {len(df)} rows")

    fig = go.Figure()

    # Class boundary polygons
    for cls, verts in USDA_POLYGONS.items():
        clay_v  = [v[0] for v in verts] + [verts[0][0]]
        silt_v  = [v[1] for v in verts] + [verts[0][1]]
        sand_v  = [v[2] for v in verts] + [verts[0][2]]
        color   = CLASS_COLOR_MAP[cls]
        fig.add_trace(go.Scatterternary(
            a=clay_v, b=silt_v, c=sand_v,
            mode="lines",
            line=dict(color="rgba(0,0,0,0.3)", width=1),
            fill="toself",
            fillcolor=(f"rgba({int(color[1:3],16)},{int(color[3:5],16)},{int(color[5:7],16)},0.12)"
                       if color.startswith("#") else color),
            name=cls,
            showlegend=True,
            hoverinfo="skip",
        ))

    # Sample points colored by class
    for cls in CLASS_LIST:
        sub = df[df["class"] == cls]
        if len(sub) == 0:
            continue
        fig.add_trace(go.Scatterternary(
            a=sub["clay"], b=sub["silt"], c=sub["sand"],
            mode="markers",
            marker=dict(color=CLASS_COLOR_MAP[cls], size=4, opacity=0.7),
            name=cls,
            showlegend=False,
            hovertemplate="Clay=%{a:.1f}%<br>Silt=%{b:.1f}%<br>Sand=%{c:.1f}%<br>" + cls + "<extra></extra>",
        ))

    fig.update_layout(
        title=dict(text="USDA Soil Texture Triangle — WoSIS Topsoil Samples", x=0.5),
        ternary=dict(
            sum=100,
            aaxis=dict(title="Clay %", min=0),
            baxis=dict(title="Silt %", min=0),
            caxis=dict(title="Sand %", min=0),
        ),
        legend=dict(
            orientation="v", x=1.02, y=0.5,
            font=dict(size=10),
            itemsizing="constant",
        ),
        margin=dict(t=60, b=40, l=60, r=160),
        height=520,
    )
    apply_theme(fig)
    return fig


fig = generate()
fig.show()
Made with Plotly