
Stress-strain curve
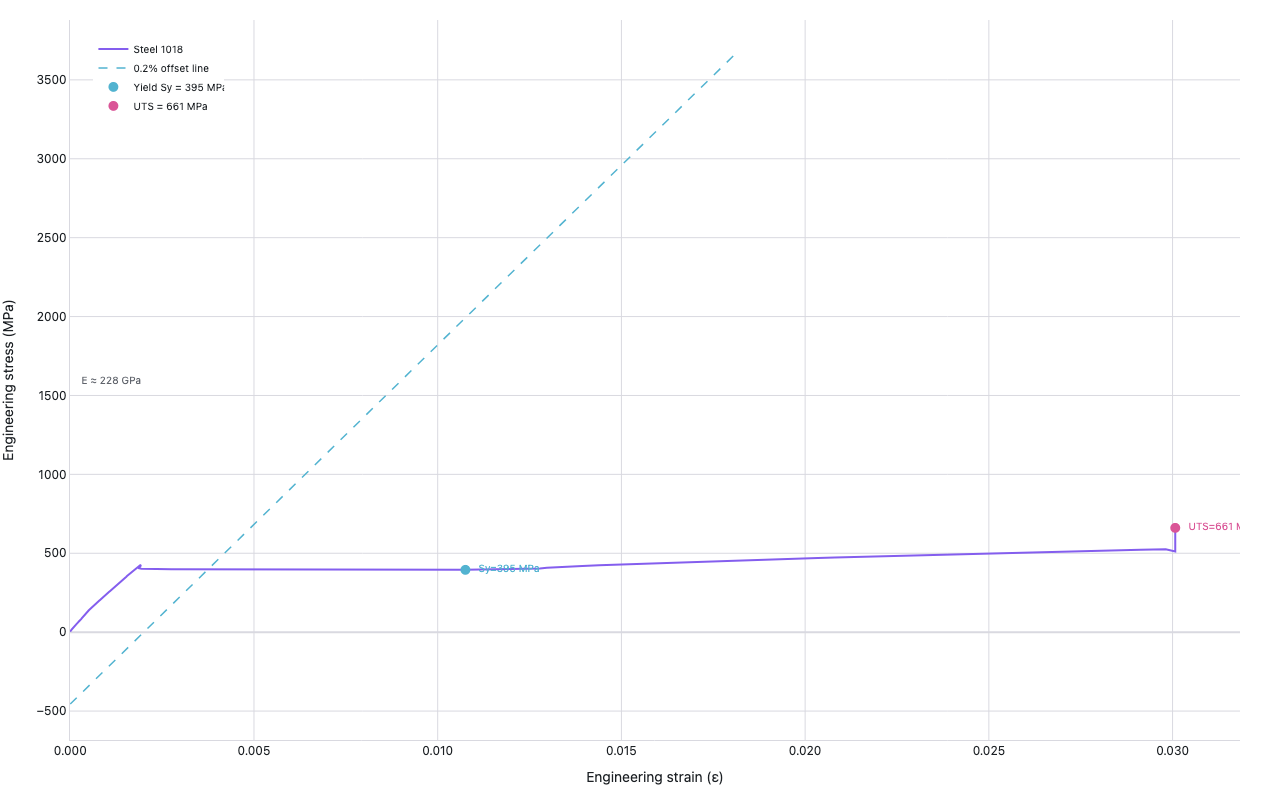
Mechanical Engineering — AISI 1018 steel tensile test
Example from the compendium of canonical charts
Python Code
"""Mechanical Engineering — Stress-strain curve (AISI 1018 steel tensile test)."""
import tempfile
from pathlib import Path

# ── Palette + theme (matching the Plotly Studio gallery these charts ship in) ──
VIOLET, TEAL, GREEN, PINK, ORANGE = "#845EEE", "#52B3D0", "#55B685", "#DA5597", "#E9A23B"
PRIMARY, SECONDARY = VIOLET, TEAL
COLORWAY = [VIOLET, TEAL, GREEN, PINK, ORANGE]
BG, TEXT, GRID, MUTED = "#ffffff", "#1c2024", "#d9d9e0", "#60646c"
FONT = "Inter, -apple-system, BlinkMacSystemFont, sans-serif"
COLORSCALE = [[0, "rgba(132, 94, 238, 0.05)"], [1, "rgba(132, 94, 238, 0.9)"]]


def apply_theme(fig):
    """Light gallery theme: white background, Inter font, soft gridlines."""
    fig.update_layout(
        paper_bgcolor=BG, plot_bgcolor=BG, colorway=COLORWAY,
        font=dict(family=FONT, color=TEXT, size=12),
        legend=dict(font=dict(color=TEXT)),
        hoverlabel=dict(bgcolor="#f0f0f3", font=dict(color=TEXT, family=FONT), bordercolor=GRID),
    )
    fig.update_xaxes(gridcolor=GRID, linecolor=GRID, zerolinecolor=GRID)
    fig.update_yaxes(gridcolor=GRID, linecolor=GRID, zerolinecolor=GRID)


def fetch_csv(url, **kwargs):
    import io
    import pandas as pd
    import requests
    r = requests.get(url, timeout=60)
    r.raise_for_status()
    return pd.read_csv(io.StringIO(r.text), **kwargs)


def fetch_json(url):
    import requests
    r = requests.get(url, timeout=60)
    r.raise_for_status()
    return r.json()

import numpy as np
import plotly.graph_objects as go
import requests
import warnings

warnings.filterwarnings("ignore")
requests.packages.urllib3.disable_warnings()  # type: ignore


URL = (
    "https://github.com/ProfessorKazarinoff/Engineering-Materials-Programming/"
    "raw/main/Engineering-Materials-Programming-Book/07-Mechanical-Properties/"
    "Steel1018_raw_data.xls"
)


def load_excel():
    try:
        import pandas as pd

        print("  downloading xls ...")
        r = requests.get(URL, verify=False, timeout=60)
        r.raise_for_status()

        with tempfile.NamedTemporaryFile(suffix=".xls", delete=False) as f:
            f.write(r.content)
            tmp = f.name

        # Try the named sheet first
        try:
            df = pd.read_excel(tmp, sheet_name="Curve_Table")
        except Exception:
            df = pd.read_excel(tmp, sheet_name=0)

        print(f"  columns: {list(df.columns)}")
        print(f"  shape: {df.shape}")
        return df
    except Exception as e:
        print(f"  excel load failed ({e})")
        return None


def find_col(df, candidates):
    for cand in candidates:
        for col in df.columns:
            if cand.lower() in str(col).lower():
                return col
    return None


def generate():
    import pandas as pd

    df = load_excel()
    synthetic = False

    if df is not None:
        force_col = find_col(df, ["force", "load", "lb"])
        ext_col   = find_col(df, ["ext", "extension", "strain", "%"])

        if force_col is None or ext_col is None:
            print(f"  could not find force/ext columns in {list(df.columns)}")
            df = None

    if df is None:
        print("  using synthetic stress-strain curve for 1018 steel")
        synthetic = True

        # Piecewise synthetic curve for 1018 steel
        # Elastic: E = 200 GPa, yield ≈ 370 MPa, UTS ≈ 440 MPa, fracture ≈ 350 MPa
        strain_elastic = np.linspace(0, 0.00185, 50)   # up to ~370 MPa
        stress_elastic = 200e3 * strain_elastic         # MPa (E=200 GPa)

        # Work-hardening: yield to UTS
        strain_wh = np.linspace(0.00185, 0.20, 150)
        stress_wh = 370 + (440 - 370) * (
            1 - np.exp(-10 * (strain_wh - 0.00185))
        )

        # Necking/softening: UTS to fracture
        strain_neck = np.linspace(0.20, 0.30, 50)
        stress_neck = 440 * (1 - 1.5 * (strain_neck - 0.20))
        stress_neck = np.clip(stress_neck, 340, 440)

        strain_all = np.concatenate([strain_elastic, strain_wh, strain_neck])
        stress_all = np.concatenate([stress_elastic, stress_wh, stress_neck])
        rng = np.random.default_rng(7)
        stress_all += rng.normal(0, 1.5, len(stress_all))

        force_col = None
        ext_col   = None
    else:
        # Convert real data
        import pandas as pd
        df[force_col] = pd.to_numeric(df[force_col], errors="coerce")
        df[ext_col]   = pd.to_numeric(df[ext_col],   errors="coerce")
        df = df.dropna(subset=[force_col, ext_col])

        # Specimen geometry
        A0 = np.pi * (0.505 / 2) ** 2   # in²  (0.505 inch diameter round)

        stress_psi = df[force_col].values / A0
        stress_all = stress_psi * 6894.76 / 1e6   # psi → MPa

        strain_all = df[ext_col].values / 100       # % → fraction
        print(f"  stress range: {stress_all.min():.0f} – {stress_all.max():.0f} MPa")
        print(f"  strain range: {strain_all.min():.4f} – {strain_all.max():.4f}")

    # --- Key properties ---
    uts_idx = int(np.argmax(stress_all))
    UTS     = stress_all[uts_idx]
    UTS_strain = strain_all[uts_idx]

    # Elastic modulus from linear region (0 to ~50% of max stress)
    mask_elastic = stress_all < 0.5 * UTS
    if mask_elastic.sum() > 3:
        from numpy.polynomial import polynomial as P
        coeffs = np.polyfit(strain_all[mask_elastic], stress_all[mask_elastic], 1)
        E_GPa = coeffs[0] / 1e3   # MPa/fraction → GPa
    else:
        E_GPa = 200.0

    # 0.2% offset yield: find intersection of (stress vs strain) with offset line
    offset_line = E_GPa * 1e3 * (strain_all - 0.002)
    diff = stress_all - offset_line
    # Sign changes
    sign_changes = np.where(np.diff(np.sign(diff)))[0]
    if len(sign_changes) > 0:
        idx_yield = sign_changes[0] + 1
    else:
        idx_yield = int(np.argmin(np.abs(diff)))

    Sy       = stress_all[idx_yield]
    Sy_strain = strain_all[idx_yield]

    print(f"  E ≈ {E_GPa:.0f} GPa, Sy ≈ {Sy:.0f} MPa, UTS ≈ {UTS:.0f} MPa")

    fig = go.Figure()

    # Main stress-strain curve
    fig.add_trace(go.Scatter(
        x=strain_all,
        y=stress_all,
        mode="lines",
        name="Steel 1018" + (" (synthetic)" if synthetic else ""),
        line=dict(color=VIOLET, width=2),
        hovertemplate="ε=%{x:.4f}<br>σ=%{y:.1f} MPa<extra></extra>",
    ))

    # 0.2% offset line
    strain_offset = np.linspace(0, strain_all.max() * 0.6, 100)
    stress_offset = E_GPa * 1e3 * (strain_offset - 0.002)
    fig.add_trace(go.Scatter(
        x=strain_offset,
        y=stress_offset,
        mode="lines",
        name="0.2% offset line",
        line=dict(color=TEAL, width=1.5, dash="dash"),
    ))

    # Yield point marker
    fig.add_trace(go.Scatter(
        x=[Sy_strain],
        y=[Sy],
        mode="markers+text",
        name=f"Yield Sy = {Sy:.0f} MPa",
        marker=dict(color=TEAL, size=10, symbol="circle"),
        text=[f"  Sy={Sy:.0f} MPa"],
        textposition="middle right",
        textfont=dict(size=10, color=TEAL),
    ))

    # UTS marker
    fig.add_trace(go.Scatter(
        x=[UTS_strain],
        y=[UTS],
        mode="markers+text",
        name=f"UTS = {UTS:.0f} MPa",
        marker=dict(color=PINK, size=10, symbol="circle"),
        text=[f"  UTS={UTS:.0f} MPa"],
        textposition="middle right",
        textfont=dict(size=10, color=PINK),
    ))

    fig.update_layout(
        xaxis=dict(title="Engineering strain (ε)", tickformat=".3f"),
        yaxis=dict(title="Engineering stress (MPa)"),
        legend=dict(x=0.02, y=0.98, xanchor="left", yanchor="top", font=dict(size=10)),
        margin=dict(t=20, b=60, l=70, r=40),
        annotations=[
            dict(
                text=f"E ≈ {E_GPa:.0f} GPa",
                x=0.01, y=0.5,
                xref="paper", yref="paper",
                showarrow=False,
                font=dict(size=10, color=MUTED),
                xanchor="left",
            )
        ],
    )

    apply_theme(fig)
    return fig


fig = generate()
fig.show()
Made with Plotly