
Strike-zone heat map + spray chart for Mike Trout
Baseball — Statcast
Example from the compendium of canonical charts
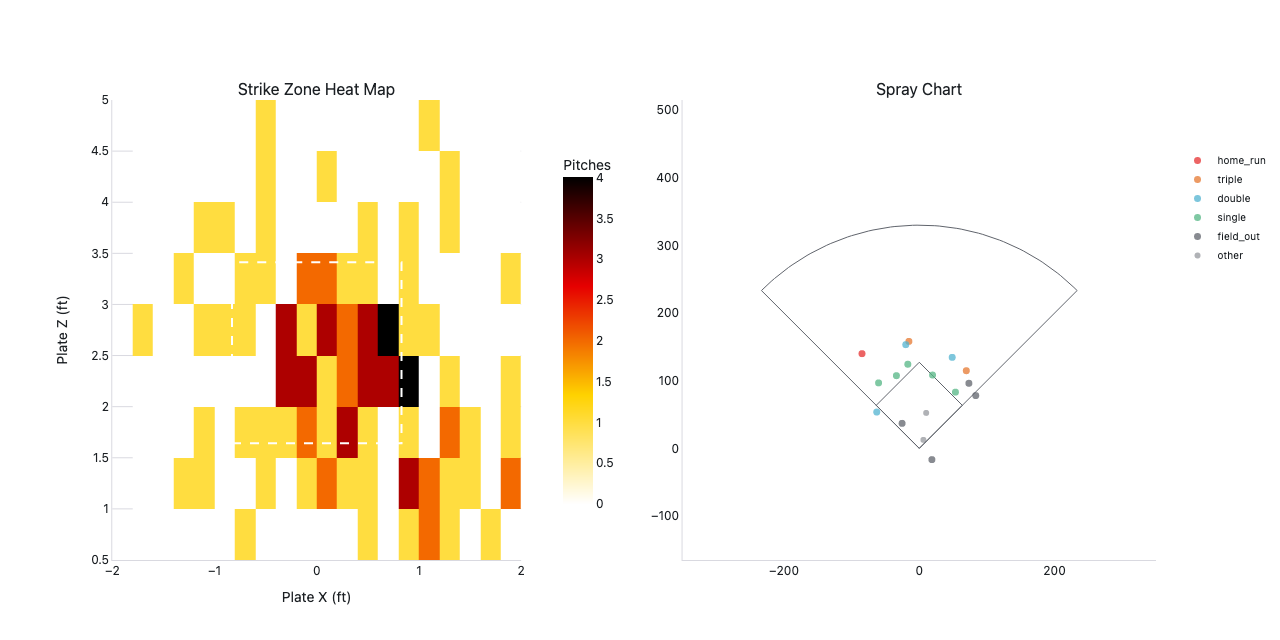
Python Code
"""Baseball — Strike-zone heat map + spray chart for Mike Trout (Statcast)."""
from pathlib import Path

# ── Palette + theme (matching the Plotly Studio gallery these charts ship in) ──
VIOLET, TEAL, GREEN, PINK, ORANGE = "#845EEE", "#52B3D0", "#55B685", "#DA5597", "#E9A23B"
PRIMARY, SECONDARY = VIOLET, TEAL
COLORWAY = [VIOLET, TEAL, GREEN, PINK, ORANGE]
BG, TEXT, GRID, MUTED = "#ffffff", "#1c2024", "#d9d9e0", "#60646c"
FONT = "Inter, -apple-system, BlinkMacSystemFont, sans-serif"
COLORSCALE = [[0, "rgba(132, 94, 238, 0.05)"], [1, "rgba(132, 94, 238, 0.9)"]]


def apply_theme(fig):
    """Light gallery theme: white background, Inter font, soft gridlines."""
    fig.update_layout(
        paper_bgcolor=BG, plot_bgcolor=BG, colorway=COLORWAY,
        font=dict(family=FONT, color=TEXT, size=12),
        legend=dict(font=dict(color=TEXT)),
        hoverlabel=dict(bgcolor="#f0f0f3", font=dict(color=TEXT, family=FONT), bordercolor=GRID),
    )
    fig.update_xaxes(gridcolor=GRID, linecolor=GRID, zerolinecolor=GRID)
    fig.update_yaxes(gridcolor=GRID, linecolor=GRID, zerolinecolor=GRID)


def fetch_csv(url, **kwargs):
    import io
    import pandas as pd
    import requests
    r = requests.get(url, timeout=60)
    r.raise_for_status()
    return pd.read_csv(io.StringIO(r.text), **kwargs)


def fetch_json(url):
    import requests
    r = requests.get(url, timeout=60)
    r.raise_for_status()
    return r.json()

import numpy as np
import pandas as pd
import plotly.graph_objects as go
from plotly.subplots import make_subplots
import io, requests, warnings


# Mike Trout statcast data
STATCAST_URL = (
    "https://baseballsavant.mlb.com/statcast_search/csv"
    "?all=true&type=details&batters_lookup[]=545361"
    "&game_date_gt=2018-05-01&game_date_lt=2018-05-07"
)

EVENT_COLORS = {
    "home_run": "#e63030",
    "triple": "#e67830",
    "double": TEAL,
    "single": GREEN,
    "field_out": MUTED,
    "strikeout": MUTED,
    "walk": VIOLET,
}


def make_synthetic():
    RNG = np.random.default_rng(11)
    n = 250
    plate_x = RNG.normal(0, 0.75, n)
    plate_z = RNG.normal(2.5, 0.55, n)
    sz_top = np.full(n, 3.5)
    sz_bot = np.full(n, 1.5)
    events_choices = ["single", "double", "home_run", "strikeout",
                      "field_out", "walk", None]
    hc_x = RNG.normal(125.42, 40, n)
    hc_y = RNG.normal(198.27 - 80, 40, n)
    events = RNG.choice(events_choices, n)
    return pd.DataFrame({
        "plate_x": plate_x, "plate_z": plate_z,
        "sz_top": sz_top, "sz_bot": sz_bot,
        "hc_x": hc_x, "hc_y": hc_y, "events": events,
    })


def generate():
    print("fetching Statcast pitch data …")
    df = None
    try:
        warnings.filterwarnings("ignore")
        headers = {
            "User-Agent": "Mozilla/5.0 (Macintosh; Intel Mac OS X 10_15_7) "
                          "AppleWebKit/537.36 (KHTML, like Gecko) Chrome/120 Safari/537.36"
        }
        r = requests.get(STATCAST_URL, headers=headers, verify=False, timeout=30)
        r.raise_for_status()
        df = pd.read_csv(io.StringIO(r.text))
        df = df[df["plate_x"].notna() & df["plate_z"].notna()]
        print(f"  loaded {len(df)} pitches")
    except Exception as e:
        print(f"  download failed ({e}), using synthetic pitch data")
        df = None

    if df is None:
        df = make_synthetic()

    df["spray_x"] = df["hc_x"] - 125.42
    df["spray_y"] = 198.27 - df["hc_y"]

    fig = make_subplots(
        rows=1, cols=2,
        subplot_titles=["Strike Zone Heat Map", "Spray Chart"],
        horizontal_spacing=0.12,
    )

    fig.add_trace(go.Histogram2d(
        x=df["plate_x"],
        y=df["plate_z"],
        colorscale="Hot",
        reversescale=True,
        nbinsx=20,
        nbinsy=20,
        colorbar=dict(title="Pitches", x=0.44, len=0.8),
        name="Pitch density",
    ), row=1, col=1)

    sz_top_avg = float(df["sz_top"].median()) if "sz_top" in df.columns else 3.5
    sz_bot_avg = float(df["sz_bot"].median()) if "sz_bot" in df.columns else 1.5
    fig.add_shape(type="rect",
        x0=-0.83, x1=0.83, y0=sz_bot_avg, y1=sz_top_avg,
        line=dict(color="white", width=2, dash="dash"),
        fillcolor="rgba(0,0,0,0)",
        row=1, col=1)

    contact = df[df["hc_x"].notna() & df["hc_y"].notna()].copy()

    # Outfield arc
    theta_field = np.linspace(np.radians(45), np.radians(135), 80)
    of_x = 330 * np.cos(theta_field)
    of_y = 330 * np.sin(theta_field)
    fig.add_trace(go.Scatter(
        x=np.concatenate([[0], of_x, [0]]),
        y=np.concatenate([[0], of_y, [0]]),
        mode="lines",
        line=dict(color=MUTED, width=1),
        showlegend=False,
        hoverinfo="skip",
    ), row=1, col=2)

    # Infield diamond
    diamond_x = [0, 90 * np.cos(np.radians(45)), 0, -90 * np.cos(np.radians(45)), 0]
    diamond_y = [0, 90 * np.sin(np.radians(45)), 90 * np.sqrt(2), 90 * np.sin(np.radians(45)), 0]
    fig.add_trace(go.Scatter(
        x=diamond_x, y=diamond_y,
        mode="lines",
        line=dict(color=MUTED, width=1),
        showlegend=False,
        hoverinfo="skip",
    ), row=1, col=2)

    for ev, color in EVENT_COLORS.items():
        sub = contact[contact["events"] == ev]
        if len(sub) == 0:
            continue
        fig.add_trace(go.Scatter(
            x=sub["spray_x"],
            y=sub["spray_y"],
            mode="markers",
            marker=dict(size=7, color=color, opacity=0.75),
            name=ev,
        ), row=1, col=2)

    other = contact[~contact["events"].isin(list(EVENT_COLORS.keys()) + [None])]
    if len(other):
        fig.add_trace(go.Scatter(
            x=other["spray_x"], y=other["spray_y"],
            mode="markers",
            marker=dict(size=6, color=MUTED, opacity=0.5),
            name="other",
        ), row=1, col=2)

    # Strike zone: fixed aspect ratio (1 ft x = 1 ft y)
    fig.update_xaxes(title_text="Plate X (ft)", range=[-2.0, 2.0],
                     scaleanchor="y", scaleratio=1, constrain="domain", row=1, col=1)
    fig.update_yaxes(title_text="Plate Z (ft)", range=[0.5, 5],
                     constrain="domain", row=1, col=1)
    fig.update_xaxes(title_text="", range=[-350, 350], row=1, col=2,
                     scaleanchor="y2", scaleratio=1, showgrid=False, zeroline=False)
    fig.update_yaxes(title_text="", range=[-30, 380], row=1, col=2,
                     showgrid=False, zeroline=False)

    fig.update_layout(
        legend=dict(x=1.02, y=0.9, font=dict(size=10)),
    )

    apply_theme(fig)
    return fig


fig = generate()
fig.show()
Made with Plotly