
Technical Analysis
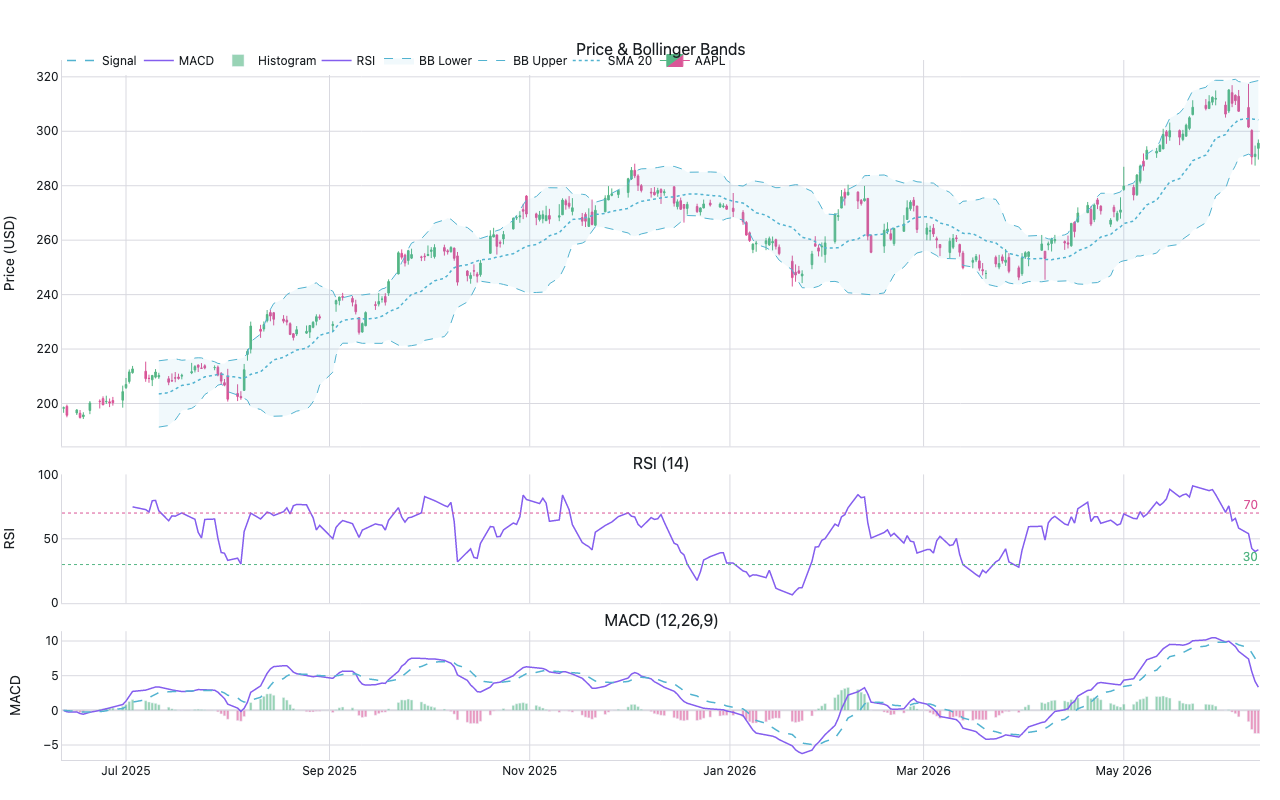
Price panel with Bollinger Bands, RSI, and MACD for AAPL
Example from the compendium of canonical charts
Python Code
"""Technical Analysis — Price panel with Bollinger Bands, RSI, and MACD for AAPL."""
from pathlib import Path

# ── Palette + theme (matching the Plotly Studio gallery these charts ship in) ──
VIOLET, TEAL, GREEN, PINK, ORANGE = "#845EEE", "#52B3D0", "#55B685", "#DA5597", "#E9A23B"
PRIMARY, SECONDARY = VIOLET, TEAL
COLORWAY = [VIOLET, TEAL, GREEN, PINK, ORANGE]
BG, TEXT, GRID, MUTED = "#ffffff", "#1c2024", "#d9d9e0", "#60646c"
FONT = "Inter, -apple-system, BlinkMacSystemFont, sans-serif"
COLORSCALE = [[0, "rgba(132, 94, 238, 0.05)"], [1, "rgba(132, 94, 238, 0.9)"]]


def apply_theme(fig):
    """Light gallery theme: white background, Inter font, soft gridlines."""
    fig.update_layout(
        paper_bgcolor=BG, plot_bgcolor=BG, colorway=COLORWAY,
        font=dict(family=FONT, color=TEXT, size=12),
        legend=dict(font=dict(color=TEXT)),
        hoverlabel=dict(bgcolor="#f0f0f3", font=dict(color=TEXT, family=FONT), bordercolor=GRID),
    )
    fig.update_xaxes(gridcolor=GRID, linecolor=GRID, zerolinecolor=GRID)
    fig.update_yaxes(gridcolor=GRID, linecolor=GRID, zerolinecolor=GRID)


def fetch_csv(url, **kwargs):
    import io
    import pandas as pd
    import requests
    r = requests.get(url, timeout=60)
    r.raise_for_status()
    return pd.read_csv(io.StringIO(r.text), **kwargs)


def fetch_json(url):
    import requests
    r = requests.get(url, timeout=60)
    r.raise_for_status()
    return r.json()

import numpy as np
import pandas as pd
import plotly.graph_objects as go
from plotly.subplots import make_subplots
import warnings
warnings.filterwarnings("ignore")


def fetch_aapl():
    try:
        import yfinance as yf
        df = yf.download("AAPL", period="1y", auto_adjust=True, progress=False)
        if df.empty or len(df) < 30:
            raise ValueError("insufficient data")
        # Flatten MultiIndex columns if present
        if isinstance(df.columns, pd.MultiIndex):
            df.columns = df.columns.get_level_values(0)
        df.index = pd.to_datetime(df.index)
        return df
    except Exception as e:
        print(f"  yfinance failed ({e}), using synthetic data")
        return None


def make_synthetic():
    """Synthetic OHLCV data resembling AAPL 1-year history."""
    rng = np.random.default_rng(42)
    dates = pd.bdate_range("2025-06-01", periods=252)
    close = 180.0
    closes = [close]
    for _ in range(251):
        close = close * np.exp(rng.normal(0.0003, 0.015))
        closes.append(close)
    closes = np.array(closes)
    highs = closes * (1 + np.abs(rng.normal(0, 0.008, 252)))
    lows = closes * (1 - np.abs(rng.normal(0, 0.008, 252)))
    opens = closes * (1 + rng.normal(0, 0.005, 252))
    volume = rng.integers(50_000_000, 120_000_000, 252)
    df = pd.DataFrame({"Open": opens, "High": highs, "Low": lows,
                        "Close": closes, "Volume": volume}, index=dates)
    return df


def compute_indicators(df):
    close = df["Close"]
    # Bollinger Bands (20-day)
    sma20 = close.rolling(20).mean()
    std20 = close.rolling(20).std()
    bb_upper = sma20 + 2 * std20
    bb_lower = sma20 - 2 * std20

    # RSI(14)
    delta = close.diff()
    gain = delta.clip(lower=0).rolling(14).mean()
    loss = (-delta.clip(upper=0)).rolling(14).mean()
    rs = gain / loss.replace(0, np.nan)
    rsi = 100 - 100 / (1 + rs)

    # MACD(12,26,9)
    ema12 = close.ewm(span=12, adjust=False).mean()
    ema26 = close.ewm(span=26, adjust=False).mean()
    macd_line = ema12 - ema26
    signal_line = macd_line.ewm(span=9, adjust=False).mean()
    histogram = macd_line - signal_line

    return sma20, bb_upper, bb_lower, rsi, macd_line, signal_line, histogram


def build_fig(df):
    sma20, bb_upper, bb_lower, rsi, macd_line, signal_line, histogram = compute_indicators(df)
    dates = df.index

    fig = make_subplots(
        rows=3, cols=1,
        shared_xaxes=True,
        row_heights=[0.60, 0.20, 0.20],
        vertical_spacing=0.04,
        subplot_titles=("Price & Bollinger Bands", "RSI (14)", "MACD (12,26,9)"),
    )

    # Row 1: Candlestick + Bollinger
    fig.add_trace(go.Candlestick(
        x=dates, open=df["Open"], high=df["High"],
        low=df["Low"], close=df["Close"],
        name="AAPL",
        increasing_line_color=GREEN,
        decreasing_line_color=PINK,
        increasing_fillcolor=GREEN,
        decreasing_fillcolor=PINK,
        line_width=1,
    ), row=1, col=1)

    fig.add_trace(go.Scatter(
        x=dates, y=sma20, name="SMA 20",
        line=dict(color=TEAL, width=1.5, dash="dot"),
    ), row=1, col=1)
    fig.add_trace(go.Scatter(
        x=dates, y=bb_upper, name="BB Upper",
        line=dict(color=TEAL, width=1, dash="dash"),
    ), row=1, col=1)
    fig.add_trace(go.Scatter(
        x=dates, y=bb_lower, name="BB Lower",
        line=dict(color=TEAL, width=1, dash="dash"),
        fill="tonexty",
        fillcolor="rgba(82,179,208,0.08)",
    ), row=1, col=1)

    # Row 2: RSI
    fig.add_trace(go.Scatter(
        x=dates, y=rsi, name="RSI",
        line=dict(color=VIOLET, width=1.5),
        showlegend=True,
    ), row=2, col=1)
    fig.add_hline(y=70, row=2, col=1, line_color=PINK, line_dash="dot", line_width=1,
                  annotation_text="70", annotation_font_color=PINK)
    fig.add_hline(y=30, row=2, col=1, line_color=GREEN, line_dash="dot", line_width=1,
                  annotation_text="30", annotation_font_color=GREEN)

    # Row 3: MACD
    hist_colors = [GREEN if v >= 0 else PINK for v in histogram.fillna(0)]
    fig.add_trace(go.Bar(
        x=dates, y=histogram,
        name="Histogram",
        marker_color=hist_colors,
        opacity=0.6,
    ), row=3, col=1)
    fig.add_trace(go.Scatter(
        x=dates, y=macd_line, name="MACD",
        line=dict(color=VIOLET, width=1.5),
    ), row=3, col=1)
    fig.add_trace(go.Scatter(
        x=dates, y=signal_line, name="Signal",
        line=dict(color=TEAL, width=1.5, dash="dash"),
    ), row=3, col=1)

    fig.update_layout(
        xaxis_rangeslider_visible=False,

        yaxis_title="Price (USD)",
        yaxis2_title="RSI",
        yaxis3_title="MACD",
        legend=dict(orientation="h", y=1.02, x=0),
        margin=dict(t=60, b=40, l=60, r=20),
    )
    # Fix RSI axis range
    fig.update_yaxes(range=[0, 100], row=2, col=1)

    return fig


def generate():
    df = fetch_aapl()
    if df is None:
        df = make_synthetic()
        print("  using synthetic AAPL data")
    else:
        print(f"  fetched {len(df)} trading days from yfinance")

    fig = build_fig(df)
    apply_theme(fig)
    return fig


fig = generate()
fig.show()
Made with Plotly