
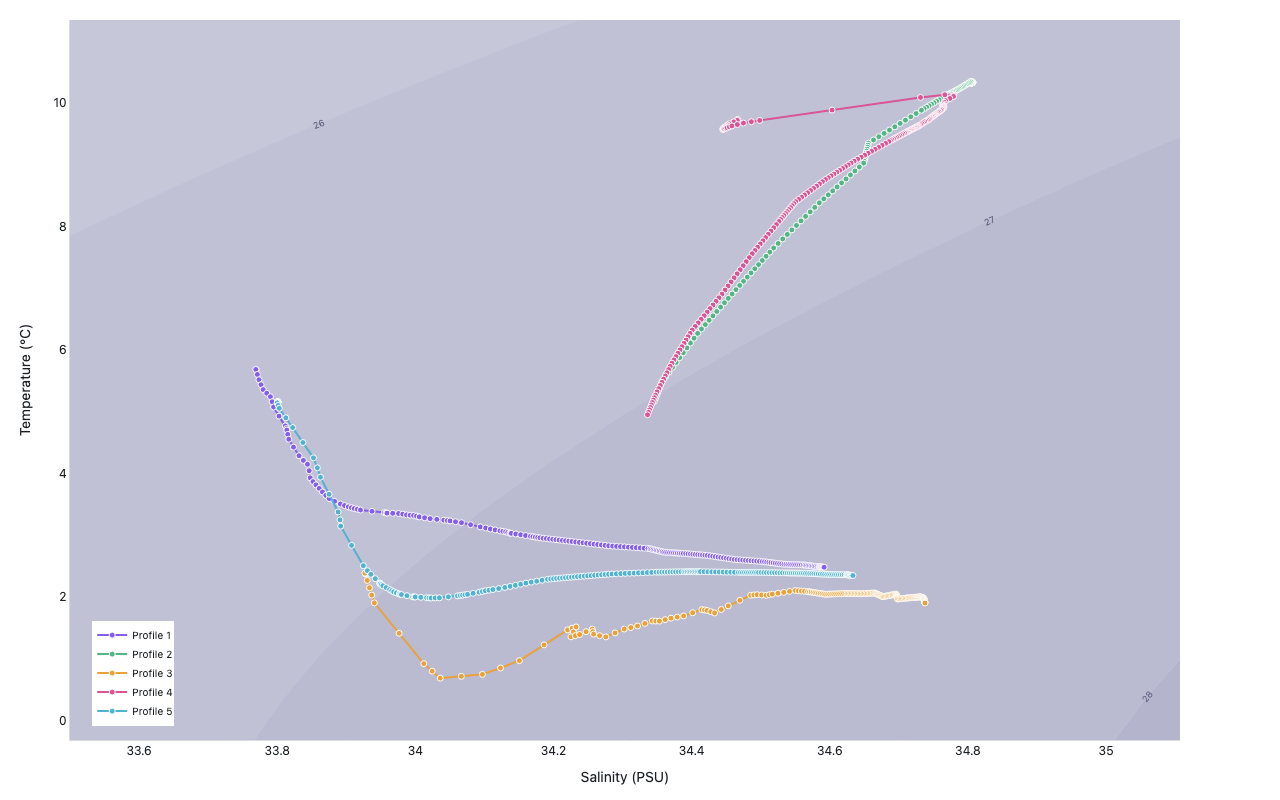
T-S diagram
Oceanography — Argo float profiles with density isolines
Example from the compendium of canonical charts
Python Code
"""Oceanography — T-S diagram (Argo float profiles with density isolines)."""
from pathlib import Path

# ── Palette + theme (matching the Plotly Studio gallery these charts ship in) ──
VIOLET, TEAL, GREEN, PINK, ORANGE = "#845EEE", "#52B3D0", "#55B685", "#DA5597", "#E9A23B"
PRIMARY, SECONDARY = VIOLET, TEAL
COLORWAY = [VIOLET, TEAL, GREEN, PINK, ORANGE]
BG, TEXT, GRID, MUTED = "#ffffff", "#1c2024", "#d9d9e0", "#60646c"
FONT = "Inter, -apple-system, BlinkMacSystemFont, sans-serif"
COLORSCALE = [[0, "rgba(132, 94, 238, 0.05)"], [1, "rgba(132, 94, 238, 0.9)"]]


def apply_theme(fig):
    """Light gallery theme: white background, Inter font, soft gridlines."""
    fig.update_layout(
        paper_bgcolor=BG, plot_bgcolor=BG, colorway=COLORWAY,
        font=dict(family=FONT, color=TEXT, size=12),
        legend=dict(font=dict(color=TEXT)),
        hoverlabel=dict(bgcolor="#f0f0f3", font=dict(color=TEXT, family=FONT), bordercolor=GRID),
    )
    fig.update_xaxes(gridcolor=GRID, linecolor=GRID, zerolinecolor=GRID)
    fig.update_yaxes(gridcolor=GRID, linecolor=GRID, zerolinecolor=GRID)


def fetch_csv(url, **kwargs):
    import io
    import pandas as pd
    import requests
    r = requests.get(url, timeout=60)
    r.raise_for_status()
    return pd.read_csv(io.StringIO(r.text), **kwargs)


def fetch_json(url):
    import requests
    r = requests.get(url, timeout=60)
    r.raise_for_status()
    return r.json()

import numpy as np
import plotly.graph_objects as go


URL_T = "https://raw.githubusercontent.com/DaniJonesOcean/GMM_example/master/Argo_T_profiles_very_small_subset.csv"
URL_S = "https://raw.githubusercontent.com/DaniJonesOcean/GMM_example/master/Argo_S_profiles_very_small_subset.csv"


def load_profiles():
    try:
        T_df = fetch_csv(URL_T)
        S_df = fetch_csv(URL_S)
        print(f"  T columns: {list(T_df.columns[:6])} ... ({T_df.shape})")
        print(f"  S columns: {list(S_df.columns[:6])} ... ({S_df.shape})")
        return T_df, S_df
    except Exception as e:
        print(f"  data load failed ({e})")
        return None, None


def generate():
    import gsw

    T_df, S_df = load_profiles()
    synthetic = False

    if T_df is not None and S_df is not None:
        # Pressure levels are columns 2+
        pressure_cols = T_df.columns[2:]
        try:
            pressure_levels = [float(c) for c in pressure_cols]
        except (ValueError, TypeError):
            pressure_levels = list(range(len(pressure_cols)))
            print(f"  non-numeric pressure columns, using index: {pressure_levels[:5]}")

        # Extract multiple profiles (up to 5)
        n_profiles = min(5, len(T_df))
        profiles = []
        for p_idx in range(n_profiles):
            T_prof = T_df.iloc[p_idx, 2:].values.astype(float)
            S_prof = S_df.iloc[p_idx, 2:].values.astype(float)
            # Remove NaN pairs
            mask = ~(np.isnan(T_prof) | np.isnan(S_prof))
            profiles.append((S_prof[mask], T_prof[mask], np.array(pressure_levels)[mask]))

        print(f"  loaded {n_profiles} profiles, first profile len={len(profiles[0][0])}")
    else:
        synthetic = True
        print("  using synthetic Argo profiles")
        # Synthetic North Atlantic-like profile
        pressure_levels = [5, 10, 15, 20, 30, 50, 75, 100, 125, 150, 200,
                           250, 300, 400, 500, 600, 700, 800, 900, 1000,
                           1100, 1200, 1500, 2000]
        p = np.array(pressure_levels, dtype=float)

        # T: warm at surface, cold at depth
        T_prof = 22 * np.exp(-p / 300) + 2 + np.random.default_rng(1).normal(0, 0.2, len(p))
        # S: slight subsurface maximum around 200 dbar, then fresher
        S_prof = 35.0 + 0.5 * np.exp(-((p - 200) ** 2) / (2 * 150**2)) + \
                 np.random.default_rng(2).normal(0, 0.05, len(p))
        profiles = [(S_prof, T_prof, p)]

    # Density isolines via gsw
    S_grid = np.linspace(33.5, 37.5, 40)
    T_grid = np.linspace(-2, 28, 40)
    S2D, T2D = np.meshgrid(S_grid, T_grid)
    sigma = gsw.sigma0(S2D, T2D)  # potential density anomaly (kg/m³)

    fig = go.Figure()

    # Density contours (background)
    fig.add_trace(go.Contour(
        x=S_grid,
        y=T_grid,
        z=sigma,
        showscale=False,
        colorscale=[[0, "#e8e8f0"], [1, "#a0a0c0"]],
        contours=dict(
            start=float(np.floor(sigma.min())),
            end=float(np.ceil(sigma.max())),
            size=1.0,
            showlabels=True,
            labelfont=dict(size=9, color="#606080"),
        ),
        line=dict(color="#c0c0d8", width=0.8),
        name="σ₀ (kg/m³)",
        hoverinfo="skip",
    ))

    # Profile traces
    colors_profiles = [VIOLET, "#55B685", "#E9A23B", "#DA5597", "#52B3D0"]
    for idx, (S_prof, T_prof, press) in enumerate(profiles):
        col = colors_profiles[idx % len(colors_profiles)]
        fig.add_trace(go.Scatter(
            x=S_prof,
            y=T_prof,
            mode="lines+markers",
            name=f"Profile {idx + 1}" + (" (synthetic)" if synthetic else ""),
            line=dict(color=col, width=2),
            marker=dict(
                color=col,
                size=6,
                line=dict(color="white", width=1),
            ),
            hovertemplate=(
                "S=%{x:.3f} PSU<br>"
                "T=%{y:.2f} °C<br>"
                f"P=%{{customdata:.0f}} dbar<extra></extra>"
            ),
            customdata=press,
        ))

    # Determine axis range from data
    all_S = np.concatenate([p[0] for p in profiles])
    all_T = np.concatenate([p[1] for p in profiles])
    s_lo = max(33.5, float(np.nanmin(all_S)) - 0.3)
    s_hi = min(37.5, float(np.nanmax(all_S)) + 0.3)
    t_lo = max(-2, float(np.nanmin(all_T)) - 1)
    t_hi = min(28, float(np.nanmax(all_T)) + 1)

    fig.update_layout(
        xaxis=dict(title="Salinity (PSU)", range=[s_lo, s_hi]),
        yaxis=dict(title="Temperature (°C)", range=[t_lo, t_hi]),
        legend=dict(
            x=0.02, y=0.02,
            xanchor="left", yanchor="bottom",
            font=dict(size=10),
        ),
        margin=dict(t=20, b=60, l=70, r=100),
    )

    apply_theme(fig)
    return fig


fig = generate()
fig.show()
Made with Plotly