
Volcano plot
rice RNA-seq differential expression
Example from the compendium of canonical charts
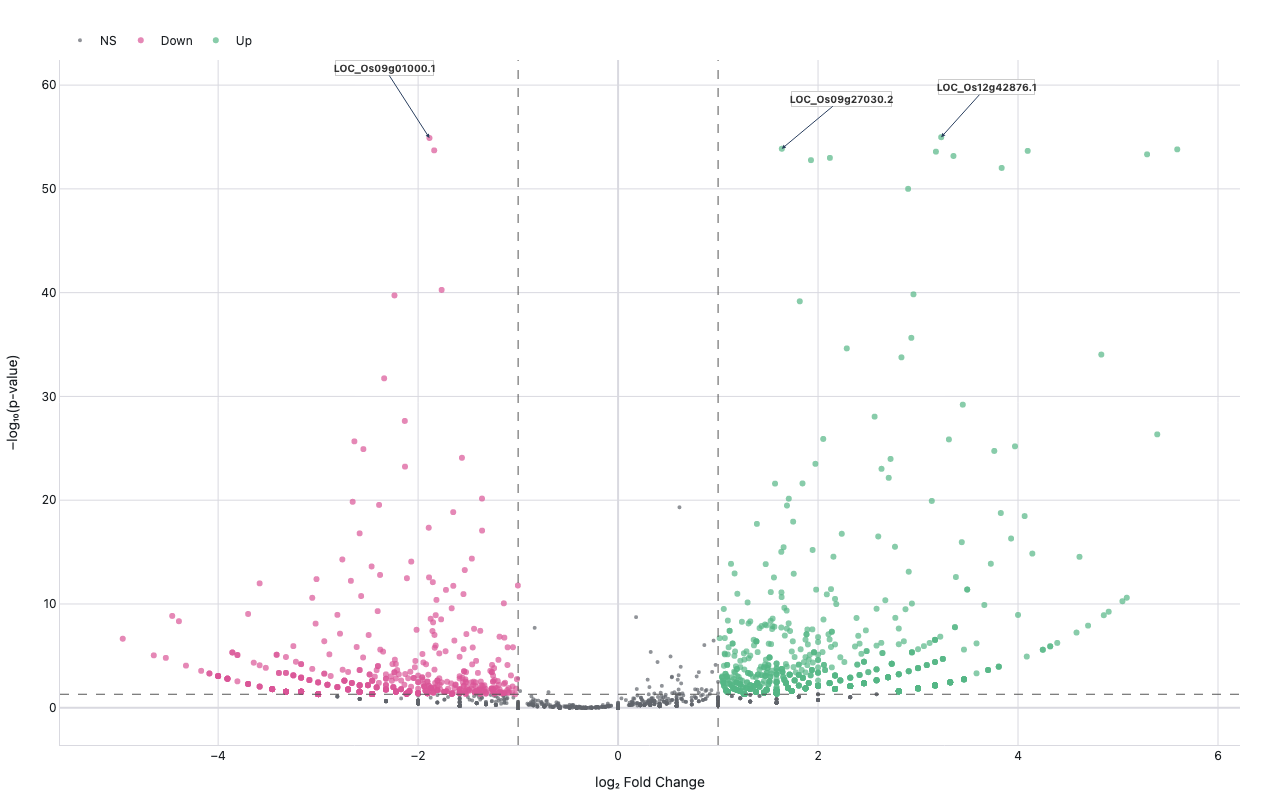
Python Code
"""Volcano plot — rice RNA-seq differential expression."""
from pathlib import Path

# ── Palette + theme (matching the Plotly Studio gallery these charts ship in) ──
VIOLET, TEAL, GREEN, PINK, ORANGE = "#845EEE", "#52B3D0", "#55B685", "#DA5597", "#E9A23B"
PRIMARY, SECONDARY = VIOLET, TEAL
COLORWAY = [VIOLET, TEAL, GREEN, PINK, ORANGE]
BG, TEXT, GRID, MUTED = "#ffffff", "#1c2024", "#d9d9e0", "#60646c"
FONT = "Inter, -apple-system, BlinkMacSystemFont, sans-serif"
COLORSCALE = [[0, "rgba(132, 94, 238, 0.05)"], [1, "rgba(132, 94, 238, 0.9)"]]


def apply_theme(fig):
    """Light gallery theme: white background, Inter font, soft gridlines."""
    fig.update_layout(
        paper_bgcolor=BG, plot_bgcolor=BG, colorway=COLORWAY,
        font=dict(family=FONT, color=TEXT, size=12),
        legend=dict(font=dict(color=TEXT)),
        hoverlabel=dict(bgcolor="#f0f0f3", font=dict(color=TEXT, family=FONT), bordercolor=GRID),
    )
    fig.update_xaxes(gridcolor=GRID, linecolor=GRID, zerolinecolor=GRID)
    fig.update_yaxes(gridcolor=GRID, linecolor=GRID, zerolinecolor=GRID)


def fetch_csv(url, **kwargs):
    import io
    import pandas as pd
    import requests
    r = requests.get(url, timeout=60)
    r.raise_for_status()
    return pd.read_csv(io.StringIO(r.text), **kwargs)


def fetch_json(url):
    import requests
    r = requests.get(url, timeout=60)
    r.raise_for_status()
    return r.json()

import numpy as np
import pandas as pd
import plotly.graph_objects as go

URL = "https://reneshbedre.github.io/assets/posts/volcano/testvolcano.csv"

LFC_THRESH = 1.0   # |log2 fold change| cutoff
P_THRESH = 0.05    # p-value cutoff


def categorize(lfc, pval):
    if pval < P_THRESH and lfc > LFC_THRESH:
        return "Up"
    if pval < P_THRESH and lfc < -LFC_THRESH:
        return "Down"
    return "NS"


PALETTE = {"Up": GREEN, "Down": PINK, "NS": MUTED}
SIZES   = {"Up": 6, "Down": 6, "NS": 4}


def generate():
    print("fetching rice RNA-seq volcano data …")
    df = fetch_csv(URL)
    df.columns = [c.strip() for c in df.columns]
    df = df.rename(columns={"GeneNames": "gene", "log2FC": "lfc", "p-value": "pval"})
    df = df.dropna(subset=["lfc", "pval"])
    df = df[df["pval"] > 0]
    df["neg_log10_p"] = -np.log10(df["pval"])
    df["cat"] = df.apply(lambda r: categorize(r["lfc"], r["pval"]), axis=1)

    # Subsample NS to keep payload small; keep all significant points.
    ns_sample = df[df["cat"] == "NS"].sample(n=min(1000, (df["cat"] == "NS").sum()), random_state=42)
    df_plot = pd.concat([ns_sample, df[df["cat"] != "NS"]]).reset_index(drop=True)

    traces = []
    for cat in ["NS", "Down", "Up"]:
        sub = df_plot[df_plot["cat"] == cat]
        traces.append(go.Scatter(
            x=sub["lfc"],
            y=sub["neg_log10_p"],
            mode="markers",
            name=cat,
            marker=dict(color=PALETTE[cat], size=SIZES[cat], opacity=0.7),
            text=sub["gene"],
            hovertemplate="%{text}<br>log₂FC=%{x:.2f}, −log₁₀p=%{y:.2f}<extra></extra>",
        ))

    up_n   = (df["cat"] == "Up").sum()
    down_n = (df["cat"] == "Down").sum()

    fig = go.Figure(traces)
    fig.add_vline(x= LFC_THRESH, line=dict(dash="dash", color="#555", width=1))
    fig.add_vline(x=-LFC_THRESH, line=dict(dash="dash", color="#555", width=1))
    fig.add_hline(y=-np.log10(P_THRESH), line=dict(dash="dash", color="#555", width=1))

    # label top 3 hits by significance with staggered annotations to avoid overlap
    top3 = df[df["cat"] != "NS"].nlargest(3, "neg_log10_p").reset_index(drop=True)
    ay_offsets = [-50, -70, -50]
    ax_offsets = [45, -45, 60]
    for i, row in top3.iterrows():
        fig.add_annotation(
            x=row["lfc"], y=row["neg_log10_p"],
            text=f"<b>{row['gene']}</b>",
            showarrow=True, arrowhead=2, arrowsize=0.8,
            ax=ax_offsets[i], ay=ay_offsets[i],
            font=dict(size=10, color="#333"),
            bgcolor="rgba(255,255,255,0.88)",
            bordercolor="#ccc",
        )
    fig.update_layout(
        title=dict(text=f"Volcano Plot — Rice RNA-seq (↑{up_n} up, ↓{down_n} down)", x=0.5),
        xaxis=dict(title="log₂ Fold Change"),
        yaxis=dict(title="−log₁₀(p-value)"),
        legend=dict(orientation="h", y=1.05),
        margin=dict(t=60, b=50, l=60, r=40),
        height=480,
    )
    apply_theme(fig)
    return fig


fig = generate()
fig.show()
Made with Plotly