
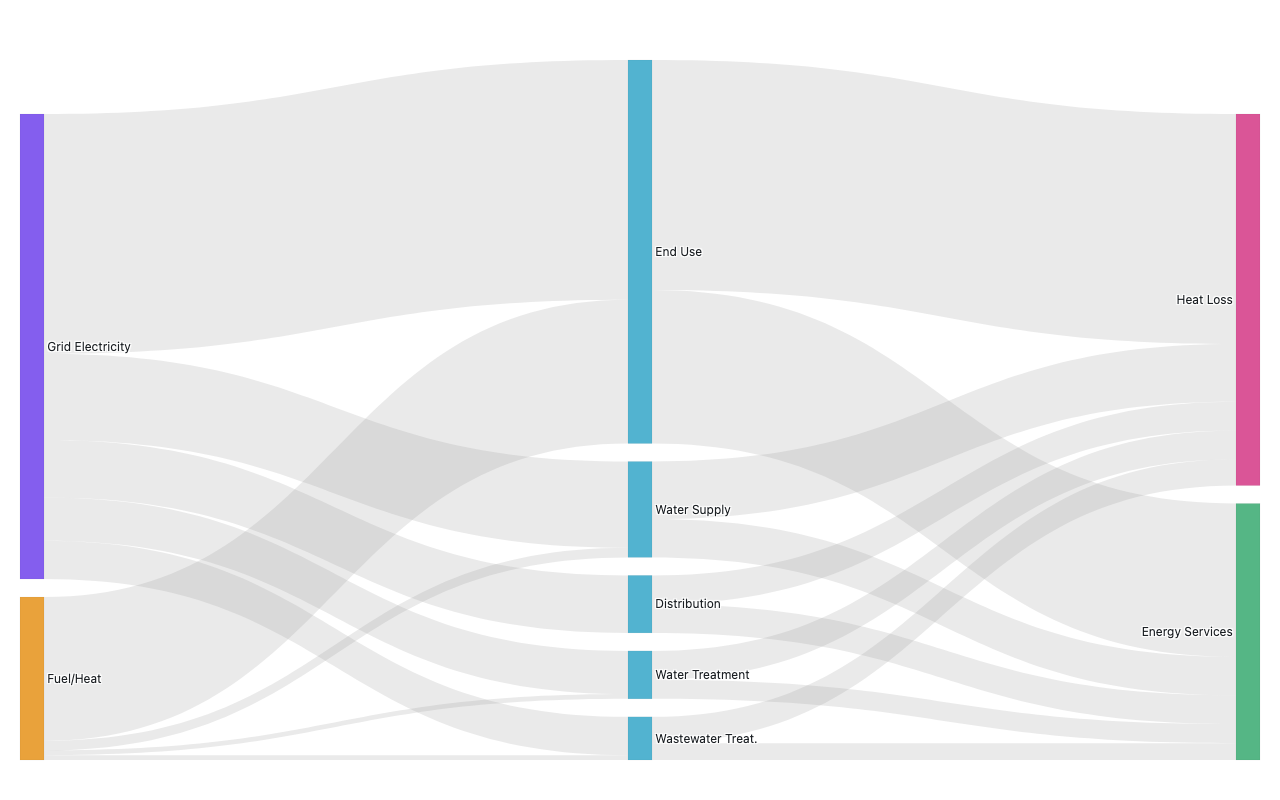
Water-Energy Nexus Sankey
water system energy intensity flow
Example from the compendium of canonical charts
Python Code
"""Water-Energy Nexus Sankey — water system energy intensity flow."""
from pathlib import Path

# ── Palette + theme (matching the Plotly Studio gallery these charts ship in) ──
VIOLET, TEAL, GREEN, PINK, ORANGE = "#845EEE", "#52B3D0", "#55B685", "#DA5597", "#E9A23B"
PRIMARY, SECONDARY = VIOLET, TEAL
COLORWAY = [VIOLET, TEAL, GREEN, PINK, ORANGE]
BG, TEXT, GRID, MUTED = "#ffffff", "#1c2024", "#d9d9e0", "#60646c"
FONT = "Inter, -apple-system, BlinkMacSystemFont, sans-serif"
COLORSCALE = [[0, "rgba(132, 94, 238, 0.05)"], [1, "rgba(132, 94, 238, 0.9)"]]


def apply_theme(fig):
    """Light gallery theme: white background, Inter font, soft gridlines."""
    fig.update_layout(
        paper_bgcolor=BG, plot_bgcolor=BG, colorway=COLORWAY,
        font=dict(family=FONT, color=TEXT, size=12),
        legend=dict(font=dict(color=TEXT)),
        hoverlabel=dict(bgcolor="#f0f0f3", font=dict(color=TEXT, family=FONT), bordercolor=GRID),
    )
    fig.update_xaxes(gridcolor=GRID, linecolor=GRID, zerolinecolor=GRID)
    fig.update_yaxes(gridcolor=GRID, linecolor=GRID, zerolinecolor=GRID)


def fetch_csv(url, **kwargs):
    import io
    import pandas as pd
    import requests
    r = requests.get(url, timeout=60)
    r.raise_for_status()
    return pd.read_csv(io.StringIO(r.text), **kwargs)


def fetch_json(url):
    import requests
    r = requests.get(url, timeout=60)
    r.raise_for_status()
    return r.json()

import plotly.graph_objects as go


# Water-energy nexus: energy flows (TWh/yr) through water system stages
# Based on EPRI / PNNL water-energy nexus estimates for US
# Nodes
NODES = [
    "Grid Electricity",   # 0  — energy source
    "Fuel/Heat",          # 1  — energy source
    "Water Supply",       # 2  — stage
    "Water Treatment",    # 3  — stage
    "Distribution",       # 4  — stage
    "End Use",            # 5  — stage
    "Wastewater Treat.",  # 6  — stage
    "Energy Services",    # 7  — sink
    "Heat Loss",          # 8  — sink
]

# Approximate US water sector energy use (TWh/yr)
FLOWS = [
    # Energy → Supply/Treatment
    (0, 2, 180),   # Electricity → Water Supply (pumping, desalination)
    (1, 2,  20),   # Fuel → Water Supply
    (0, 3,  90),   # Electricity → Water Treatment
    (1, 3,  10),   # Fuel → Water Treatment
    (0, 4, 120),   # Electricity → Distribution
    (0, 5, 500),   # Electricity → End Use (water heating, pumping)
    (1, 5, 300),   # Fuel → End Use (water heating)
    (0, 6,  80),   # Electricity → Wastewater Treatment
    (1, 6,  10),   # Fuel → Wastewater Treatment
    # Stage → sink
    (2, 7,  80),   (2, 8, 120),
    (3, 7,  40),   (3, 8,  60),
    (4, 7,  60),   (4, 8,  60),
    (5, 7, 320),   (5, 8, 480),
    (6, 7,  35),   (6, 8,  55),
]

NODE_COLORS = [
    "#845EEE",   # Grid Electricity
    "#E9A23B",   # Fuel/Heat
    "#52B3D0",   # Water Supply
    "#52B3D0",   # Water Treatment
    "#52B3D0",   # Distribution
    "#52B3D0",   # End Use
    "#52B3D0",   # Wastewater
    "#55B685",   # Energy Services
    "#DA5597",   # Heat Loss
]


def generate():
    print("building Water-Energy Nexus Sankey …")
    sources = [f[0] for f in FLOWS]
    targets = [f[1] for f in FLOWS]
    values  = [f[2] for f in FLOWS]

    fig = go.Figure(go.Sankey(
        node=dict(
            label=NODES,
            color=NODE_COLORS,
            pad=18, thickness=24,
            line=dict(color="rgba(0,0,0,0.08)", width=0.5),
        ),
        link=dict(
            source=sources,
            target=targets,
            value=values,
            color="rgba(150,150,150,0.2)",
        ),
    ))

    fig.update_layout(
        title=dict(text="Water-Energy Nexus (US, TWh/yr est.)", x=0.5),
        margin=dict(t=60, b=40, l=20, r=20),
        height=480,
        font=dict(size=11),
    )
    apply_theme(fig)
    return fig


fig = generate()
fig.show()
Made with Plotly