
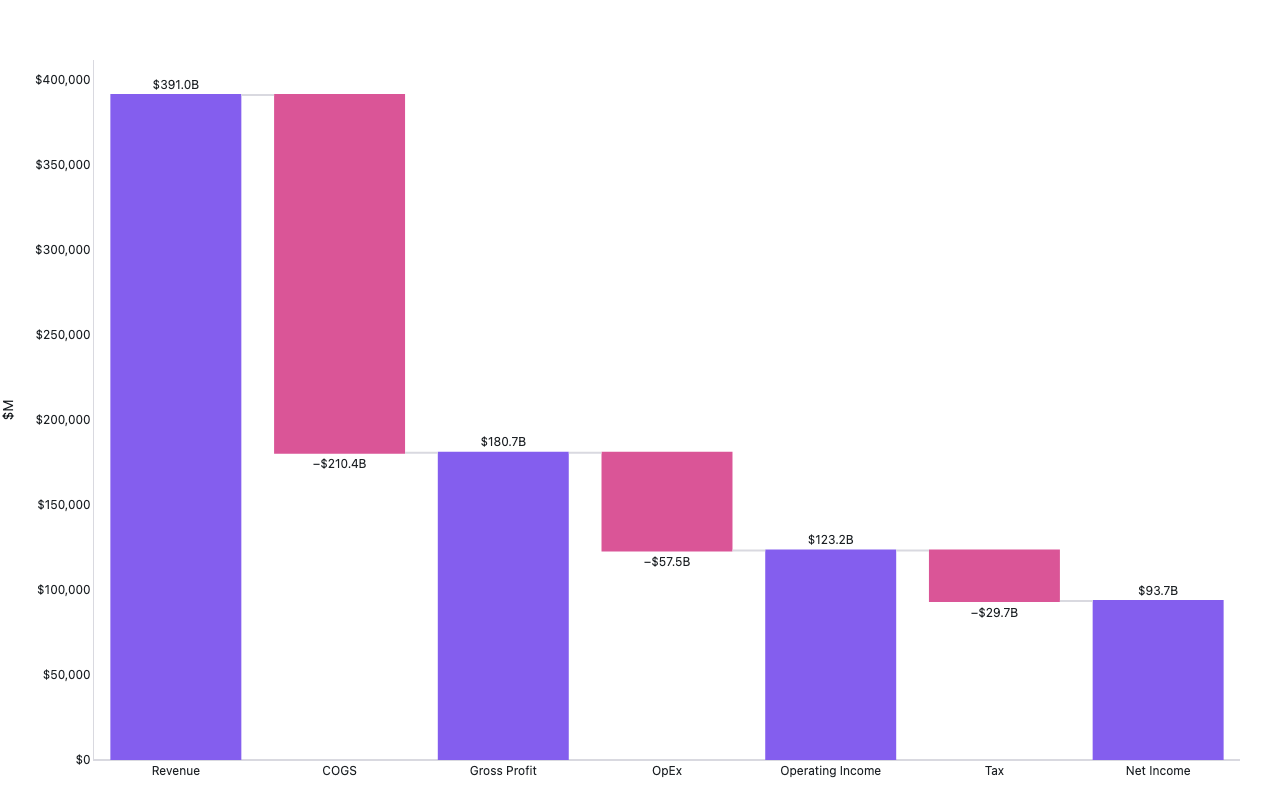
Waterfall P&L bridge
Apple FY2024 income statement (10-K, ended 2024-09-28)
Example from the compendium of canonical charts
Python Code
"""Waterfall P&L bridge — Apple FY2024 income statement (10-K, ended 2024-09-28)."""
from pathlib import Path

# ── Palette + theme (matching the Plotly Studio gallery these charts ship in) ──
VIOLET, TEAL, GREEN, PINK, ORANGE = "#845EEE", "#52B3D0", "#55B685", "#DA5597", "#E9A23B"
PRIMARY, SECONDARY = VIOLET, TEAL
COLORWAY = [VIOLET, TEAL, GREEN, PINK, ORANGE]
BG, TEXT, GRID, MUTED = "#ffffff", "#1c2024", "#d9d9e0", "#60646c"
FONT = "Inter, -apple-system, BlinkMacSystemFont, sans-serif"
COLORSCALE = [[0, "rgba(132, 94, 238, 0.05)"], [1, "rgba(132, 94, 238, 0.9)"]]


def apply_theme(fig):
    """Light gallery theme: white background, Inter font, soft gridlines."""
    fig.update_layout(
        paper_bgcolor=BG, plot_bgcolor=BG, colorway=COLORWAY,
        font=dict(family=FONT, color=TEXT, size=12),
        legend=dict(font=dict(color=TEXT)),
        hoverlabel=dict(bgcolor="#f0f0f3", font=dict(color=TEXT, family=FONT), bordercolor=GRID),
    )
    fig.update_xaxes(gridcolor=GRID, linecolor=GRID, zerolinecolor=GRID)
    fig.update_yaxes(gridcolor=GRID, linecolor=GRID, zerolinecolor=GRID)


def fetch_csv(url, **kwargs):
    import io
    import pandas as pd
    import requests
    r = requests.get(url, timeout=60)
    r.raise_for_status()
    return pd.read_csv(io.StringIO(r.text), **kwargs)


def fetch_json(url):
    import requests
    r = requests.get(url, timeout=60)
    r.raise_for_status()
    return r.json()

import plotly.graph_objects as go


# Source: Apple FY2024 10-K, all figures in $M
ROWS = [
    # (label,            value,    measure)
    ("Revenue",          391_035,  "absolute"),
    ("COGS",            -210_352,  "relative"),
    ("Gross Profit",          0,   "total"),
    ("OpEx",            -57_467,   "relative"),
    ("Operating Income",      0,   "total"),
    ("Tax",             -29_749,   "relative"),
    ("Net Income",            0,   "total"),
]

LABELS, VALUES, MEASURES = zip(*ROWS)

TEXT_LABELS = [
    "$391.0B", "−$210.4B", "$180.7B",
    "−$57.5B", "$123.2B", "−$29.7B", "$93.7B",
]


def generate():
    print("building Apple FY2024 waterfall (hardcoded 10-K data) …")
    fig = go.Figure(go.Waterfall(
        orientation="v",
        measure=list(MEASURES),
        x=list(LABELS),
        y=list(VALUES),
        text=TEXT_LABELS,
        textposition="outside",
        connector=dict(line=dict(color="#d9d9e0")),
        increasing=dict(marker=dict(color=GREEN)),
        decreasing=dict(marker=dict(color=PINK)),
        totals=dict(marker=dict(color=VIOLET)),
    ))
    fig.update_layout(
        title=dict(text="Apple FY2024 P&L Bridge ($M, ended Sep 28 2024)", x=0.5),
        yaxis=dict(title="$M", tickformat="$,.0f", showgrid=False),
        xaxis=dict(showgrid=False),
        margin=dict(t=60, b=40, l=80, r=40),
        height=460,
        showlegend=False,
    )
    apply_theme(fig)
    return fig


fig = generate()
fig.show()
Made with Plotly