
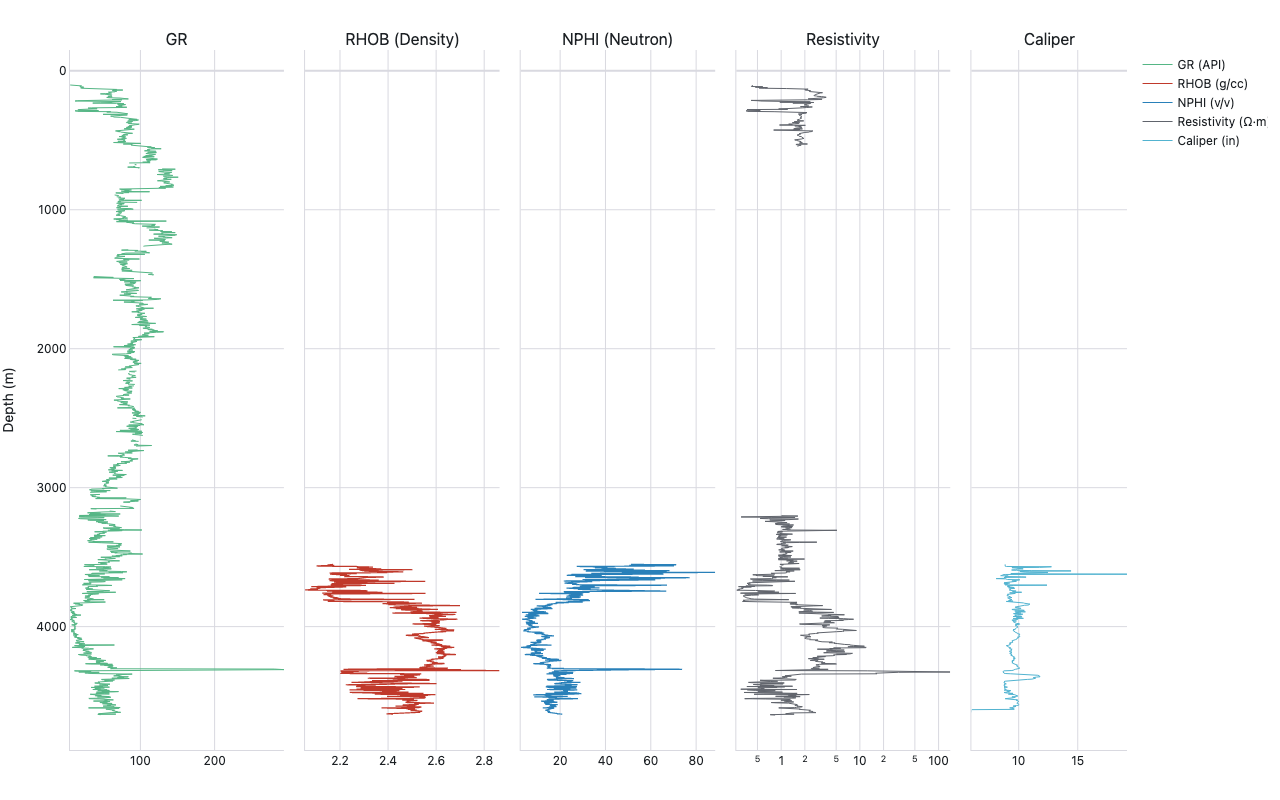
well-log strip plot
Petrophysics — GR, DEN+NEU, RDEP, CALI
Example from the compendium of canonical charts
Python Code
"""Petrophysics — well-log strip plot (GR, DEN+NEU, RDEP, CALI)."""
import tempfile
import os
from pathlib import Path

# ── Palette + theme (matching the Plotly Studio gallery these charts ship in) ──
VIOLET, TEAL, GREEN, PINK, ORANGE = "#845EEE", "#52B3D0", "#55B685", "#DA5597", "#E9A23B"
PRIMARY, SECONDARY = VIOLET, TEAL
COLORWAY = [VIOLET, TEAL, GREEN, PINK, ORANGE]
BG, TEXT, GRID, MUTED = "#ffffff", "#1c2024", "#d9d9e0", "#60646c"
FONT = "Inter, -apple-system, BlinkMacSystemFont, sans-serif"
COLORSCALE = [[0, "rgba(132, 94, 238, 0.05)"], [1, "rgba(132, 94, 238, 0.9)"]]


def apply_theme(fig):
    """Light gallery theme: white background, Inter font, soft gridlines."""
    fig.update_layout(
        paper_bgcolor=BG, plot_bgcolor=BG, colorway=COLORWAY,
        font=dict(family=FONT, color=TEXT, size=12),
        legend=dict(font=dict(color=TEXT)),
        hoverlabel=dict(bgcolor="#f0f0f3", font=dict(color=TEXT, family=FONT), bordercolor=GRID),
    )
    fig.update_xaxes(gridcolor=GRID, linecolor=GRID, zerolinecolor=GRID)
    fig.update_yaxes(gridcolor=GRID, linecolor=GRID, zerolinecolor=GRID)


def fetch_csv(url, **kwargs):
    import io
    import pandas as pd
    import requests
    r = requests.get(url, timeout=60)
    r.raise_for_status()
    return pd.read_csv(io.StringIO(r.text), **kwargs)


def fetch_json(url):
    import requests
    r = requests.get(url, timeout=60)
    r.raise_for_status()
    return r.json()

import numpy as np
import pandas as pd
import plotly.graph_objects as go
from plotly.subplots import make_subplots

LAS_URL = "https://raw.githubusercontent.com/andymcdgeo/Petrophysics-Python-Series/master/Data/15-9-19_SR_COMP.LAS"
NULL_VAL = -999.25
DECIMATE = 2000


def load_las(url):
    import requests
    import lasio
    r = requests.get(url, verify=False, timeout=60)
    r.raise_for_status()
    with tempfile.NamedTemporaryFile(suffix=".las", delete=False) as f:
        f.write(r.content)
        tmp_path = f.name
    try:
        las = lasio.read(tmp_path)
        df = las.df().reset_index()
        df.columns = [c.strip().upper() for c in df.columns]
        df.replace(NULL_VAL, np.nan, inplace=True)
        return df
    finally:
        os.unlink(tmp_path)


def generate():
    try:
        print("fetching LAS file …")
        df = load_las(LAS_URL)
        print(f"  loaded {len(df)} rows; columns: {list(df.columns)}")

        # Identify depth column
        dept_col = next((c for c in df.columns if c in ("DEPT", "DEPTH", "MD")), df.columns[0])

        # Map expected curves
        def find_col(candidates):
            for c in candidates:
                if c in df.columns:
                    return c
            return None

        gr_col   = find_col(["GR", "GR_N"])
        den_col  = find_col(["DEN", "RHOB", "RHOZ"])
        neu_col  = find_col(["NEU", "NPHI", "TNPH"])
        res_col  = find_col(["RDEP", "ILD", "RT", "RD", "LLD"])
        cal_col  = find_col(["CALI", "CAL", "CALS"])

        print(f"  curves found — GR:{gr_col} DEN:{den_col} NEU:{neu_col} RES:{res_col} CALI:{cal_col}")

        # Decimate
        step = max(1, len(df) // DECIMATE)
        df = df.iloc[::step].copy()

        depth = df[dept_col]

    except Exception as e:
        print(f"  LAS load failed ({e}); using synthetic fallback")
        np.random.seed(7)
        n = DECIMATE
        depth = np.linspace(1500, 3000, n)
        df = pd.DataFrame({
            "DEPT": depth,
            "GR":   30 + 90 * np.abs(np.sin(depth / 120)) + np.random.normal(0, 5, n),
            "RHOB": 2.1 + 0.5 * np.random.rand(n),
            "NPHI": 0.05 + 0.35 * np.random.rand(n),
            "ILD":  np.exp(1 + 3 * np.random.rand(n)),
            "CALI": 8.5 + 2 * np.random.rand(n),
        })
        dept_col = "DEPT"
        gr_col, den_col, neu_col, res_col, cal_col = "GR", "RHOB", "NPHI", "ILD", "CALI"
        depth = df[dept_col]

    fig = make_subplots(
        rows=1, cols=5,
        shared_yaxes=True,
        column_widths=[0.22, 0.20, 0.20, 0.22, 0.16],
        horizontal_spacing=0.02,
        subplot_titles=["GR", "RHOB (Density)", "NPHI (Neutron)", "Resistivity", "Caliper"],
    )

    # Track 1: GR
    if gr_col:
        fig.add_trace(go.Scatter(
            x=df[gr_col], y=depth, mode="lines",
            line=dict(color=GREEN, width=1),
            name="GR (API)", showlegend=True,
            hovertemplate="GR: %{x:.1f} API<br>Depth: %{y:.1f} m<extra></extra>",
        ), row=1, col=1)

    # Track 2: Density (RHOB) — own track, 1.95–2.95 g/cc range
    if den_col:
        fig.add_trace(go.Scatter(
            x=df[den_col], y=depth, mode="lines",
            line=dict(color="#c0392b", width=1.2),
            name="RHOB (g/cc)", showlegend=True,
            hovertemplate="RHOB: %{x:.3f} g/cc<br>Depth: %{y:.1f}<extra></extra>",
        ), row=1, col=2)

    # Track 3: Neutron porosity (NPHI) — own track
    if neu_col:
        fig.add_trace(go.Scatter(
            x=df[neu_col], y=depth, mode="lines",
            line=dict(color="#2980b9", width=1.2),
            name="NPHI (v/v)", showlegend=True,
            hovertemplate="NPHI: %{x:.3f}<br>Depth: %{y:.1f}<extra></extra>",
        ), row=1, col=3)

    # Track 4: Resistivity (log-x)
    if res_col:
        fig.add_trace(go.Scatter(
            x=df[res_col], y=depth, mode="lines",
            line=dict(color=MUTED, width=1),
            name="Resistivity (Ω·m)", showlegend=True,
            hovertemplate="Res: %{x:.2f} Ω·m<br>Depth: %{y:.1f}<extra></extra>",
        ), row=1, col=4)

    # Track 5: Caliper
    if cal_col:
        fig.add_trace(go.Scatter(
            x=df[cal_col], y=depth, mode="lines",
            line=dict(color=TEAL, width=1),
            name="Caliper (in)", showlegend=True,
            hovertemplate="CALI: %{x:.2f} in<br>Depth: %{y:.1f}<extra></extra>",
        ), row=1, col=5)

    d_min, d_max = float(depth.min()), float(depth.max())

    fig.update_layout(
        yaxis=dict(
            title="Depth (m)", autorange="reversed",
            range=[d_max, d_min],
        ),
        xaxis4=dict(type="log"),
        legend=dict(x=1.01, y=1, xanchor="left"),
        margin=dict(t=50, b=50, l=70, r=60),
        height=700,
    )
    apply_theme(fig)
    return fig


fig = generate()
fig.show()
Made with Plotly