
Wind rose
Iowa Mesonet ASOS, station DSM, full year 2023
Example from the compendium of canonical charts
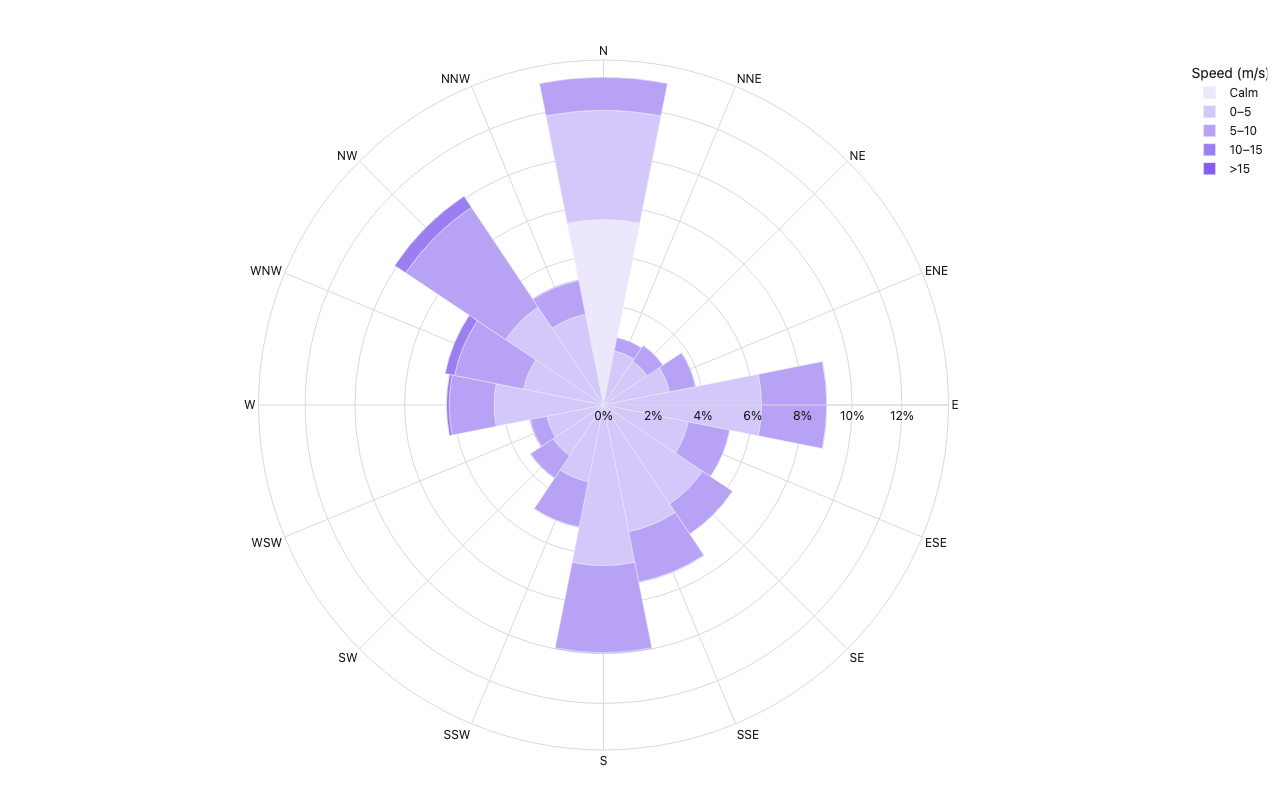
Python Code
"""Wind rose — Iowa Mesonet ASOS, station DSM, full year 2023."""
from pathlib import Path

# ── Palette + theme (matching the Plotly Studio gallery these charts ship in) ──
VIOLET, TEAL, GREEN, PINK, ORANGE = "#845EEE", "#52B3D0", "#55B685", "#DA5597", "#E9A23B"
PRIMARY, SECONDARY = VIOLET, TEAL
COLORWAY = [VIOLET, TEAL, GREEN, PINK, ORANGE]
BG, TEXT, GRID, MUTED = "#ffffff", "#1c2024", "#d9d9e0", "#60646c"
FONT = "Inter, -apple-system, BlinkMacSystemFont, sans-serif"
COLORSCALE = [[0, "rgba(132, 94, 238, 0.05)"], [1, "rgba(132, 94, 238, 0.9)"]]


def apply_theme(fig):
    """Light gallery theme: white background, Inter font, soft gridlines."""
    fig.update_layout(
        paper_bgcolor=BG, plot_bgcolor=BG, colorway=COLORWAY,
        font=dict(family=FONT, color=TEXT, size=12),
        legend=dict(font=dict(color=TEXT)),
        hoverlabel=dict(bgcolor="#f0f0f3", font=dict(color=TEXT, family=FONT), bordercolor=GRID),
    )
    fig.update_xaxes(gridcolor=GRID, linecolor=GRID, zerolinecolor=GRID)
    fig.update_yaxes(gridcolor=GRID, linecolor=GRID, zerolinecolor=GRID)


def fetch_csv(url, **kwargs):
    import io
    import pandas as pd
    import requests
    r = requests.get(url, timeout=60)
    r.raise_for_status()
    return pd.read_csv(io.StringIO(r.text), **kwargs)


def fetch_json(url):
    import requests
    r = requests.get(url, timeout=60)
    r.raise_for_status()
    return r.json()

import numpy as np
import plotly.graph_objects as go

URL = (
    "https://mesonet.agron.iastate.edu/cgi-bin/request/asos.py"
    "?station=DSM&data=drct&data=sknt"
    "&year1=2023&month1=1&day1=1"
    "&year2=2024&month2=1&day2=1"
    "&tz=Etc/UTC&format=onlycomma&missing=M&trace=T"
)

SPEED_BINS = [
    # (label,  lo_m/s, hi_m/s, color)  — solid (opaque) violet shades light→dark,
    # so the polar grid lines don't show through the bars.
    ("Calm",   0,      0.5,   "rgb(237, 231, 252)"),
    ("0–5",    0.5,    5,     "rgb(212, 199, 249)"),
    ("5–10",   5,      10,    "rgb(184, 162, 245)"),
    ("10–15",  10,     15,    "rgb(157, 126, 241)"),
    (">15",    15,     999,   VIOLET),
]

COMPASS_16 = ["N","NNE","NE","ENE","E","ESE","SE","SSE",
              "S","SSW","SW","WSW","W","WNW","NW","NNW"]


def generate():
    print(f"fetching Iowa Mesonet DSM 2023 …")
    df = fetch_csv(URL, na_values=["M", "T"])
    df = df.dropna(subset=["drct", "sknt"])
    df["ws_ms"] = df["sknt"] * 0.5144  # knots → m/s

    n_total = len(df)
    n_calm = (df["ws_ms"] < 0.5).sum()
    width = 360 / 16
    centers = np.arange(0, 360, width)  # 0°=N, clockwise

    traces = []
    for label, lo, hi, color in SPEED_BINS:
        sub = df[(df["ws_ms"] >= lo) & (df["ws_ms"] < hi)]
        rs = [
            ((sub["drct"] - c + 180) % 360 - 180).abs().lt(width / 2).sum() / n_total * 100
            for c in centers
        ]
        traces.append(go.Barpolar(
            r=rs,
            theta=centers,
            width=width,
            name=label,
            marker_color=color,
            hovertemplate="%{theta:.0f}°: %{r:.2f}%<extra>" + label + " m/s</extra>",
        ))

    fig = go.Figure(traces)
    fig.update_layout(
        title=dict(text="Wind Rose — Des Moines (DSM), 2023", x=0.5),
        polar=dict(
            angularaxis=dict(
                tickvals=list(centers),
                ticktext=COMPASS_16,
                direction="clockwise",
                rotation=90,
            ),
            radialaxis=dict(ticksuffix="%"),
        ),
        legend=dict(title="Speed (m/s)"),
        margin=dict(t=60, b=50, l=40, r=40),
        height=500,
        annotations=[dict(
            x=0, y=-0.1, xref="paper", yref="paper", showarrow=False,
            text=f"Calm ({n_calm / n_total * 100:.1f}% of obs) excluded from sectors.",
            font=dict(size=11, color="#666"),
        )],
    )
    apply_theme(fig)
    return fig


fig = generate()
fig.show()
Made with Plotly