
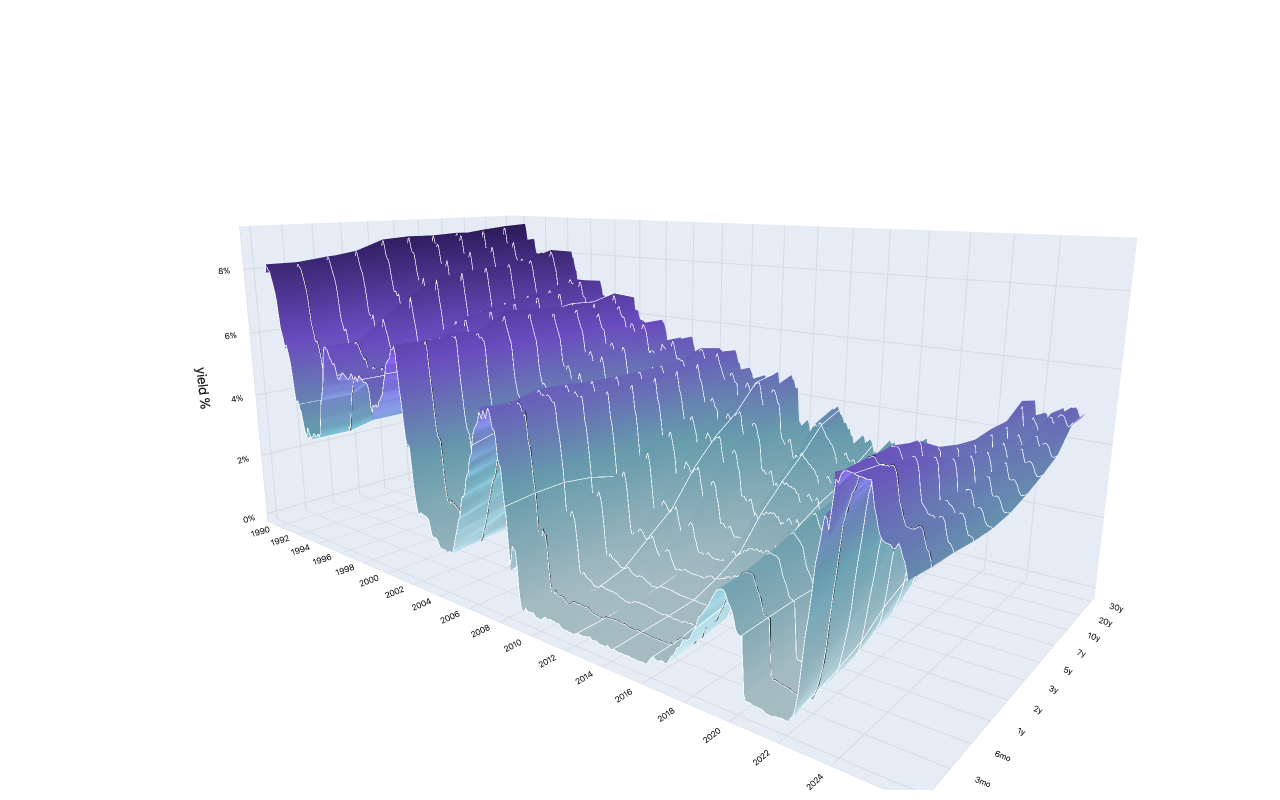
Yield curve
US Treasury daily par yields as a 3D surface over time
Example from the compendium of canonical charts
Python Code
"""Yield curve — US Treasury daily par yields as a 3D surface over time.

The classic NYT "3D yield curve" view: maturity on one axis, time on the
other, and the rate as height. Credit: Gregor Aisch & Amanda Cox, NYT.
"""
from pathlib import Path

# ── Palette + theme (matching the Plotly Studio gallery these charts ship in) ──
VIOLET, TEAL, GREEN, PINK, ORANGE = "#845EEE", "#52B3D0", "#55B685", "#DA5597", "#E9A23B"
PRIMARY, SECONDARY = VIOLET, TEAL
COLORWAY = [VIOLET, TEAL, GREEN, PINK, ORANGE]
BG, TEXT, GRID, MUTED = "#ffffff", "#1c2024", "#d9d9e0", "#60646c"
FONT = "Inter, -apple-system, BlinkMacSystemFont, sans-serif"
COLORSCALE = [[0, "rgba(132, 94, 238, 0.05)"], [1, "rgba(132, 94, 238, 0.9)"]]


def apply_theme(fig):
    """Light gallery theme: white background, Inter font, soft gridlines."""
    fig.update_layout(
        paper_bgcolor=BG, plot_bgcolor=BG, colorway=COLORWAY,
        font=dict(family=FONT, color=TEXT, size=12),
        legend=dict(font=dict(color=TEXT)),
        hoverlabel=dict(bgcolor="#f0f0f3", font=dict(color=TEXT, family=FONT), bordercolor=GRID),
    )
    fig.update_xaxes(gridcolor=GRID, linecolor=GRID, zerolinecolor=GRID)
    fig.update_yaxes(gridcolor=GRID, linecolor=GRID, zerolinecolor=GRID)


def fetch_csv(url, **kwargs):
    import io
    import pandas as pd
    import requests
    r = requests.get(url, timeout=60)
    r.raise_for_status()
    return pd.read_csv(io.StringIO(r.text), **kwargs)


def fetch_json(url):
    import requests
    r = requests.get(url, timeout=60)
    r.raise_for_status()
    return r.json()

import numpy as np
import pandas as pd
import plotly.graph_objects as go

YEARS = range(1990, 2026)
URL = (
    "https://home.treasury.gov/resource-center/data-chart-center/interest-rates/"
    "daily-treasury-rates.csv/{year}/all"
    "?type=daily_treasury_yield_curve&field_tdr_date_value={year}&page&_format=csv"
)

# Full maturity grid (months). Some tenors are absent in some years
# (1/2/4 Mo before ~2001, 20 Yr discontinued 2002–2006); we interpolate
# across whatever tenors a given day reports to fill a complete grid.
TENORS = {
    "1 Mo": 1, "2 Mo": 2, "3 Mo": 3, "4 Mo": 4, "6 Mo": 6,
    "1 Yr": 12, "2 Yr": 24, "3 Yr": 36, "5 Yr": 60,
    "7 Yr": 84, "10 Yr": 120, "20 Yr": 240, "30 Yr": 360,
}
TICK_LABELS = ["1mo", "3mo", "6mo", "1y", "2y", "3y", "5y", "7y", "10y", "20y", "30y"]
TICK_MONTHS = [1, 3, 6, 12, 24, 36, 60, 84, 120, 240, 360]


def generate():
    # Cache the 36 yearly CSVs locally so styling iterations don't refetch.
    cache = Path(__file__).parent / "_cache.parquet"
    if cache.exists():
        print("loading cached US Treasury yields …")
        df = pd.read_parquet(cache)
    else:
        print("fetching US Treasury par yield curve, 1990–2025 …")
        frames = []
        for year in YEARS:
            try:
                d = fetch_csv(URL.format(year=year))
            except Exception as e:  # noqa: BLE001
                print(f"  {year}: skipped ({e})")
                continue
            d.columns = [c.strip() for c in d.columns]
            frames.append(d)
            print(f"  {year}: {len(d)} days")
        df = pd.concat(frames, ignore_index=True)
        df.to_parquet(cache)
    date_col = next(c for c in df.columns if "date" in c.lower())
    df[date_col] = pd.to_datetime(df[date_col], errors="coerce")
    df = df.dropna(subset=[date_col]).sort_values(date_col).set_index(date_col)

    # Months present as numeric columns, sorted by tenor length.
    present = [(TENORS[c], c) for c in TENORS if c in df.columns]
    present.sort()
    months = [m for m, _ in present]
    cols = [c for _, c in present]
    yields = df[cols].apply(pd.to_numeric, errors="coerce")

    # Monthly mean → one curve per month (clean, smooth surface).
    monthly = yields.resample("MS").mean()

    # Interpolate each month's curve onto the full maturity grid in
    # log-maturity space (np.interp holds the endpoints flat where a tenor
    # is missing, e.g. 30 Yr during 2002–2006).
    log_grid = np.log(TICK_MONTHS)
    z_rows, dates = [], []
    for date, row in monthly.iterrows():
        valid = row.notna().values
        if valid.sum() < 4:
            continue
        xs = np.log(np.array(months)[valid])
        ys = row.values[valid].astype(float)
        z_rows.append(np.interp(log_grid, xs, ys))
        dates.append(date)

    z = np.array(z_rows)                       # [time, maturity]
    y_idx = np.arange(len(dates))              # time axis (months)
    x_idx = np.arange(len(TICK_MONTHS))        # maturity axis

    # Year tick positions along the time axis.
    years = pd.DatetimeIndex(dates).year
    year_ticks = [i for i in range(len(dates))
                  if i == 0 or years[i] != years[i - 1]]
    year_ticks = year_ticks[::2]               # every other year, uncluttered

    # On-palette height gradient (opaque): low rates light teal → high rates
    # deep violet, like the NYT navy ramp.
    colorscale = [
        [0.0, "#cfeaf2"],
        [0.35, "#7fc1d6"],
        [0.65, "#845EEE"],
        [1.0, "#36206e"],
    ]

    fig = go.Figure()
    fig.add_trace(go.Surface(
        x=x_idx, y=y_idx, z=z,
        colorscale=colorscale,
        showscale=False,
        opacity=1.0,
        lighting=dict(ambient=0.8, diffuse=0.55, specular=0.05, roughness=0.95),
        # Wireframe mesh — date-curve ribs (y) + maturity lines (x) — so the
        # surface reads as structured rather than amorphous.
        contours=dict(
            x=dict(show=True, color="rgba(255,255,255,0.3)", width=1),
            y=dict(show=True, color="rgba(255,255,255,0.5)", width=1),
        ),
        hovertemplate=(
            "<b>%{customdata}</b><br>"
            "yield %{z:.2f}%<extra></extra>"
        ),
        # One combined "maturity · month" label per cell — Surface hovertemplate
        # doesn't resolve %{customdata[i]} index access, so flatten to a scalar.
        customdata=np.array(
            [[f"{lab} Treasury · {d.strftime('%b %Y')}" for lab in TICK_LABELS]
             for d in dates]
        ),
    ))

    # Iconic front-edge line: the short rate (3-month) traced over time.
    short_col = TICK_MONTHS.index(3)
    fig.add_trace(go.Scatter3d(
        x=[short_col] * len(dates), y=y_idx, z=z[:, short_col],
        mode="lines",
        line=dict(color=TEXT, width=3),
        hoverinfo="skip",
        showlegend=False,
    ))

    fig.update_layout(
        scene=dict(
            xaxis=dict(
                title="", tickvals=x_idx, ticktext=TICK_LABELS,
                tickfont=dict(size=10),
            ),
            yaxis=dict(
                title="", tickvals=year_ticks,
                ticktext=[str(years[i]) for i in year_ticks],
                tickfont=dict(size=10),
                autorange="reversed",   # 1990 recedes to the back, recent years to the front
            ),
            zaxis=dict(title="yield %", ticksuffix="%", tickfont=dict(size=10)),
            aspectmode="manual",
            aspectratio=dict(x=1.0, y=2.0, z=0.85),
            camera=dict(eye=dict(x=-1.8, y=-1.5, z=0.55)),
        ),
        margin=dict(t=10, b=10, l=10, r=10),
        height=620,
    )
    apply_theme(fig)
    return fig


fig = generate()
fig.show()
Made with Plotly