“What if you don't have the dataset?”
My partner's family is from San Diego and so we frequently drive up and down the coast from San Francisco. It takes about 8-10 hours but we've grown to favor splitting up the drive in half on one side of trip and staying overnight in the little towns stuck in time along the 1 like Pismo Beach and Cayucos.
During one of these drives last year, I was in the middle of an intensely creative and industrious period building out the next version of Plotly Studio - an LLM-powered analytics and visualization app - and our roadtrip turned into a rubber duck discussion about its underpinnings and possibilities.
Talking out loud - especially to those who aren't so close to the problem - almost always brings up new ideas. In this case, it was my partner who brought up an idea - and stubbornly held on to it - that fooled me and later surprised me.
What if you don't have a dataset? Why can't the app just find the data for you?
The first step in doing any data analytics or visualization is, of course, uploading or connecting to your dataset.
The idea that we could just skip this step seemed ridiculous to me at that point. The web is mostly full of unstructured data (documents, text) and in my experience the big open data providers like Kaggle are awash with fabricated datasets (you can tell because all of the data is uniformly distributed). Reliable websites like Wikipedia don't have much in the way of structured datasets and scientific journals are often paywalled or don't include data outside of small tables embedded in PDFs.
So I shrugged off the idea.
But then, weeks later, I started just asking open ended questions while QA'ing my prototypes without providing any dataset of my own. And I found that Plotly Studio - through its LLM provider - had a curious and specific knowledge of primary source data sources on the web.
Data sources with obscure URLs serving file formats of yesteryear. A data source to seemingly help you any question that you might have about the world.
Over the last couple of months, here are some of my favorite examples of data that LLMs surfaced for me, and that have really come alive for me in my own personal life.
Water Temperatures
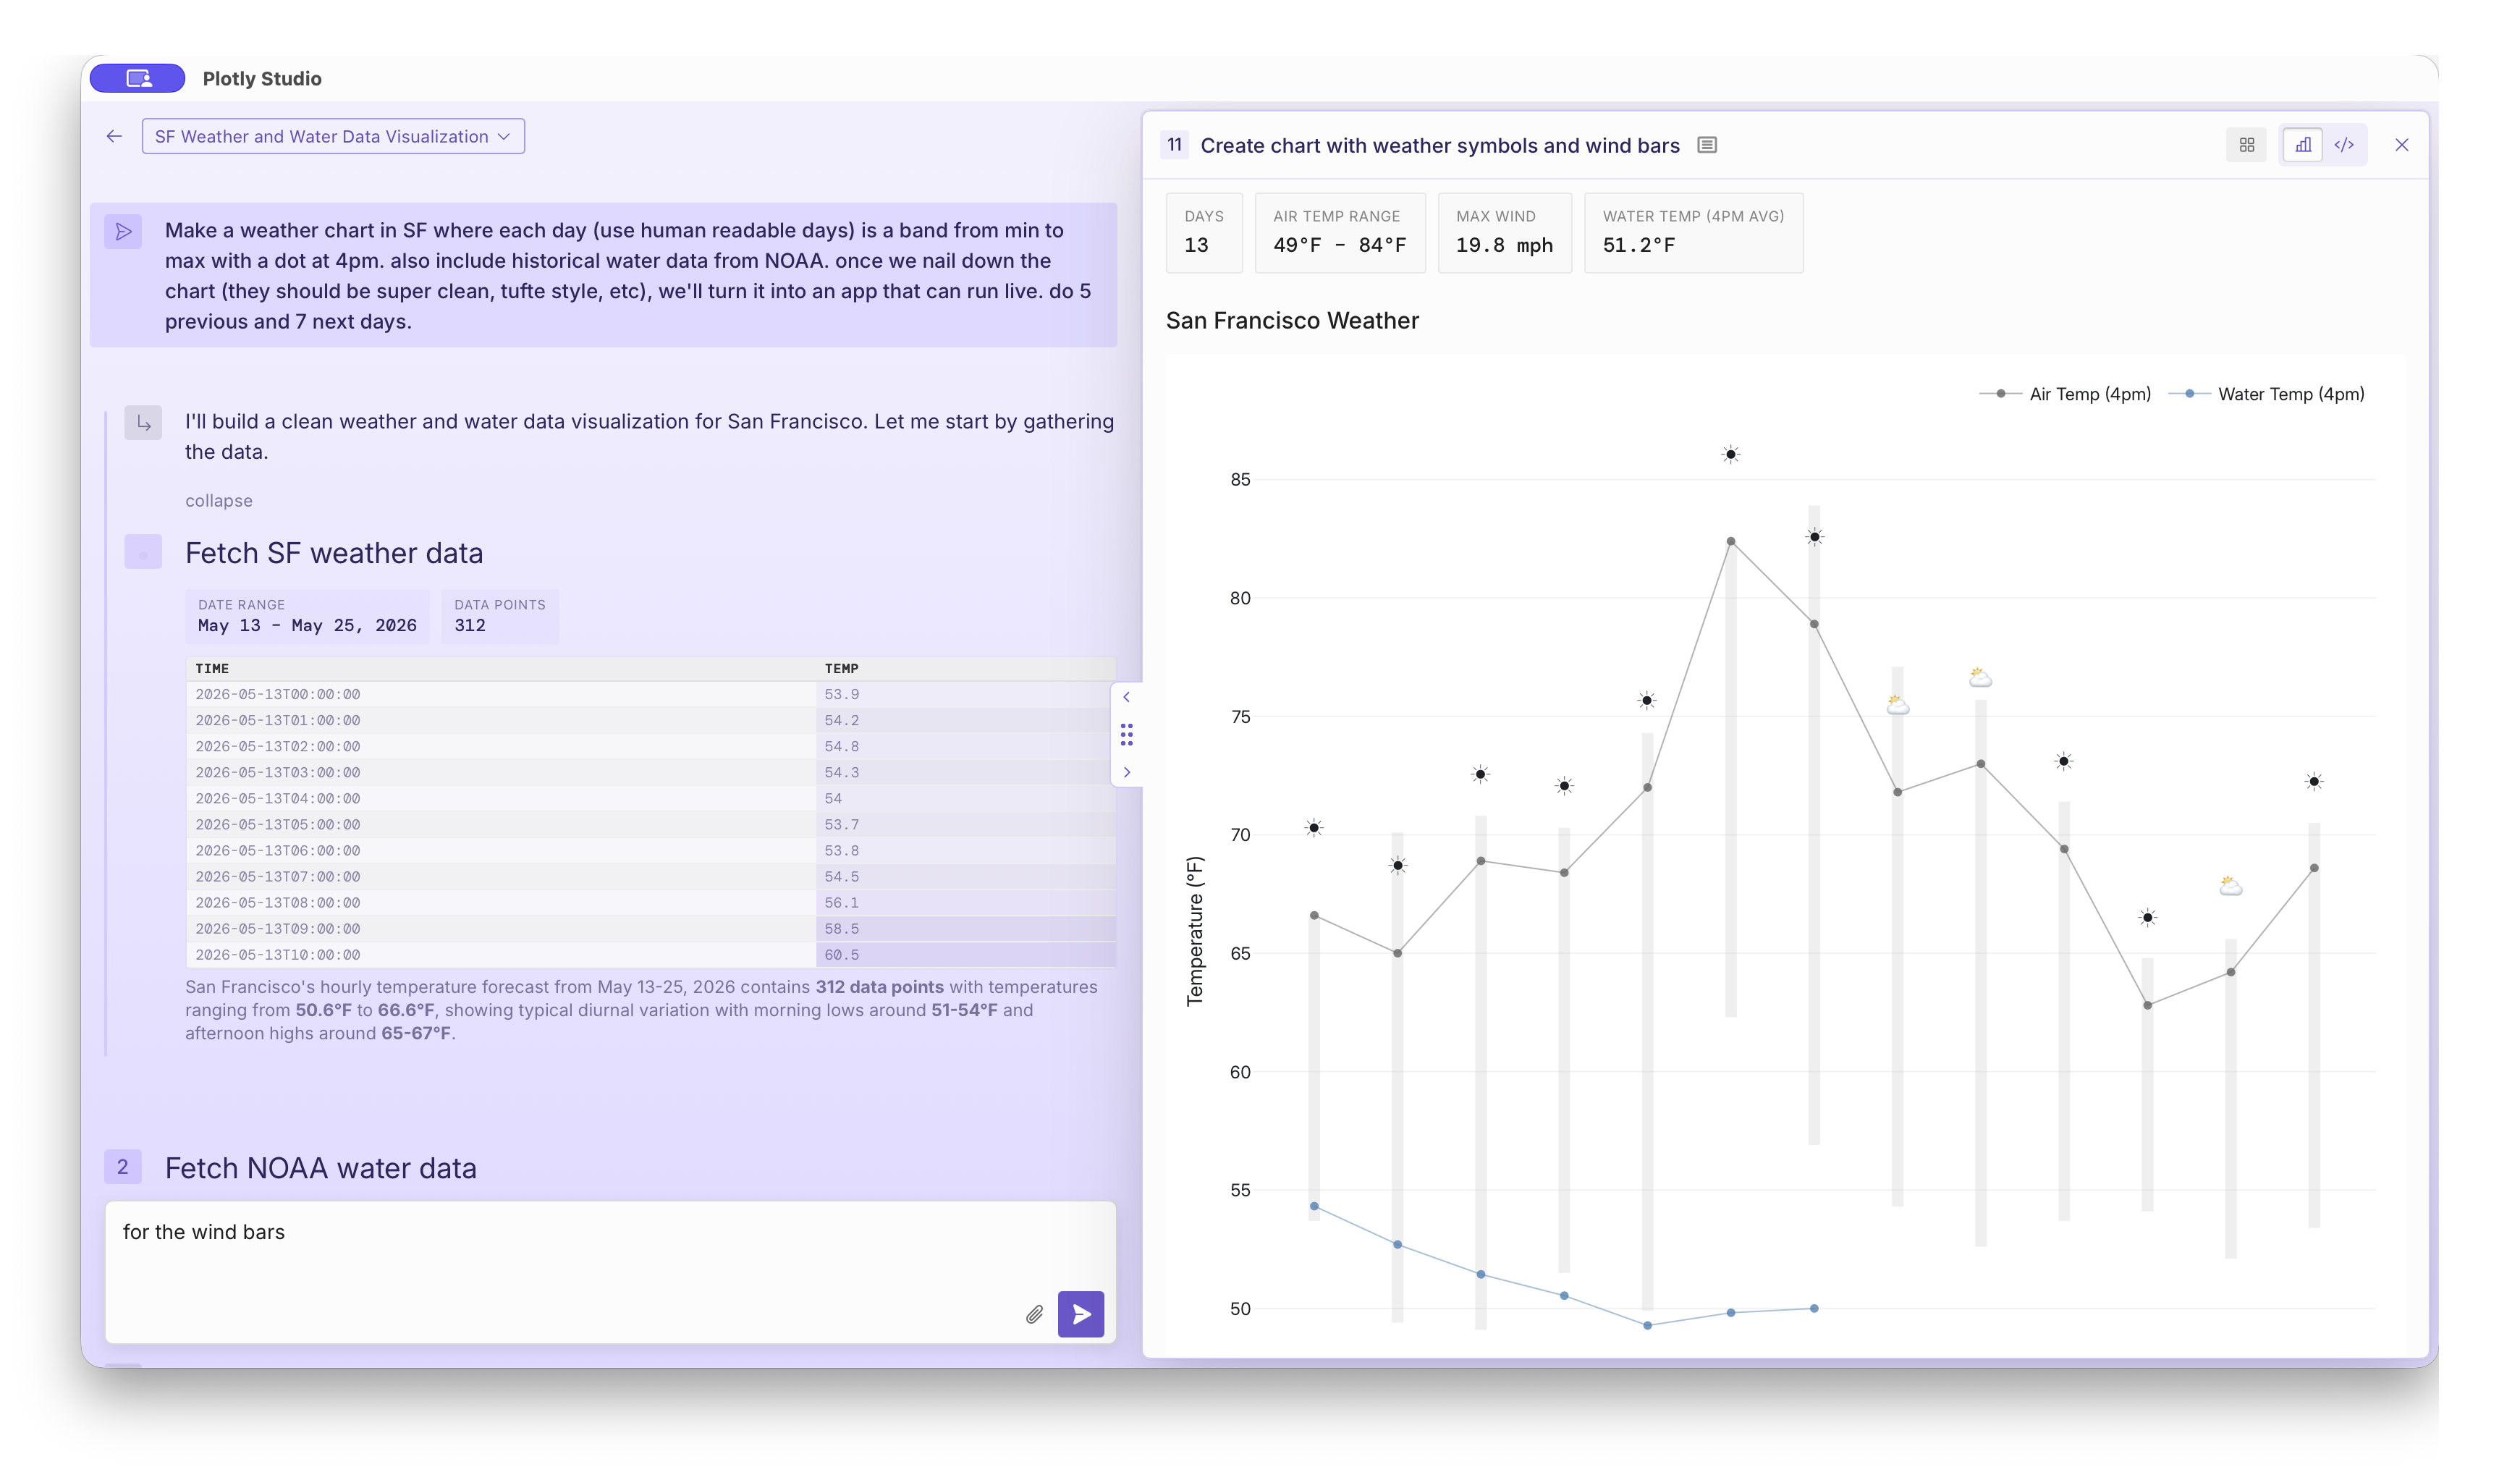
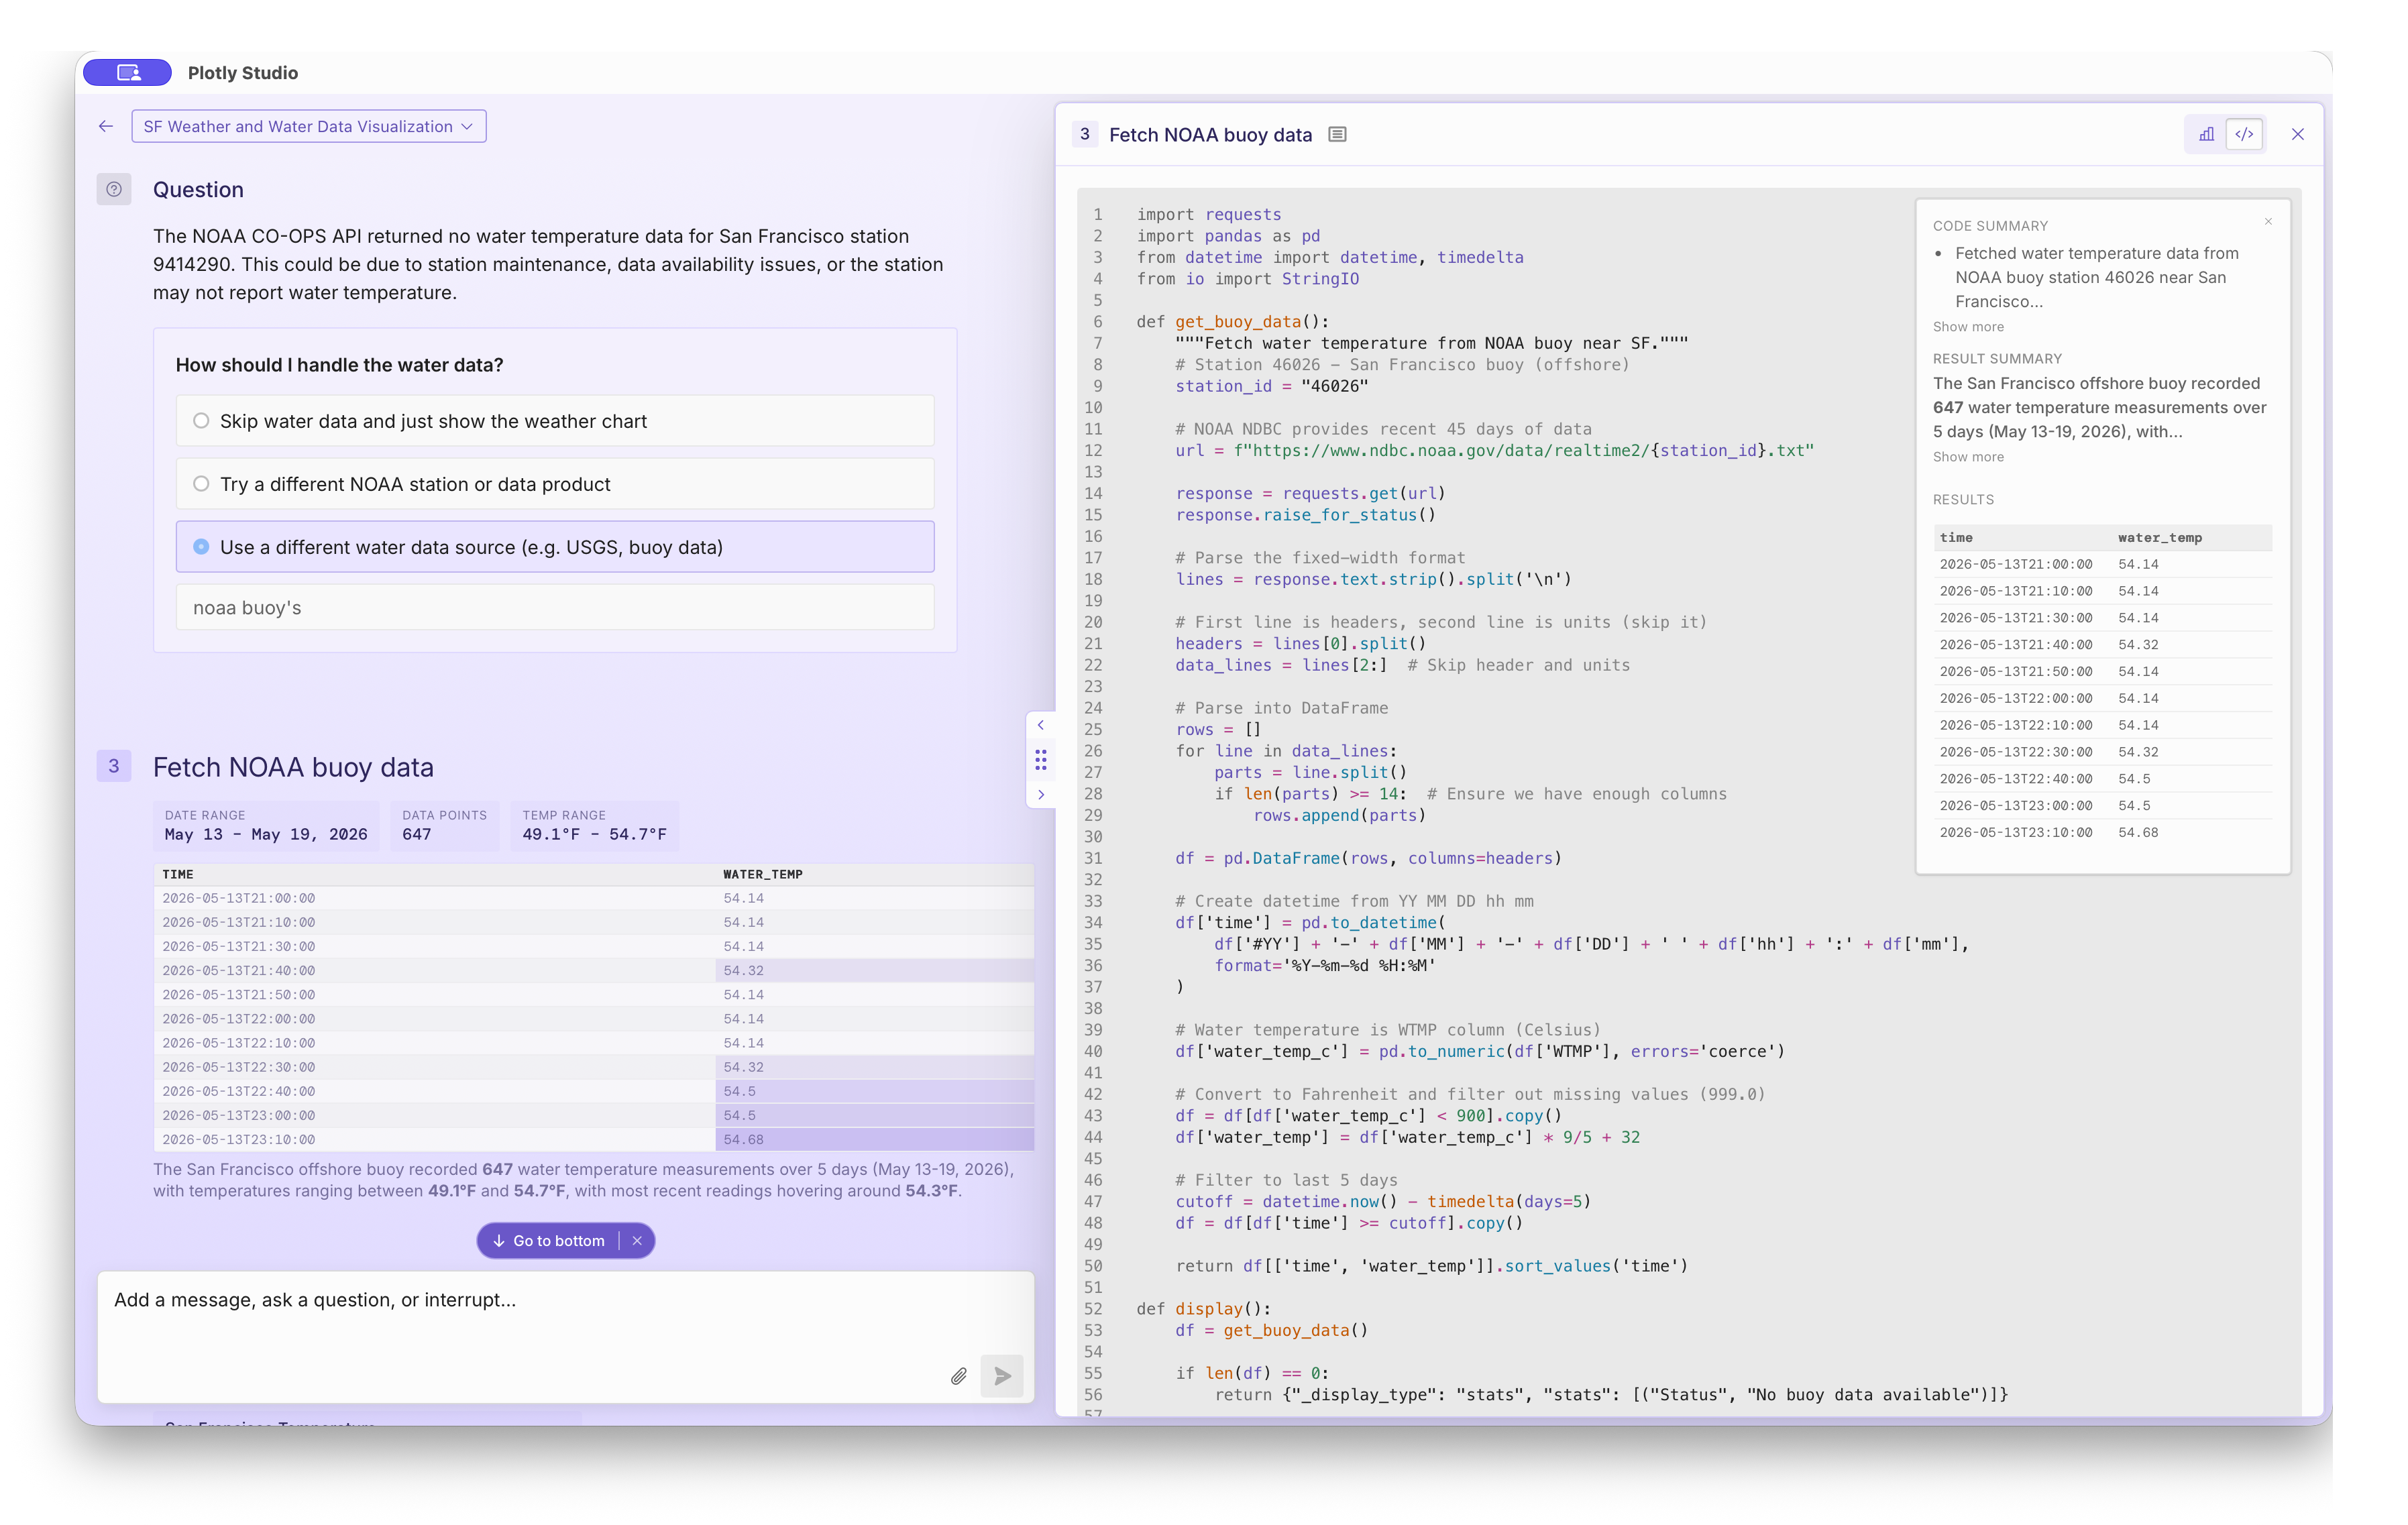
I do a fair amount of open water swimming off the coast of San Francisco and was surprised to find plentiful water temperature data courtesy of NOAA's buoys.
This data is available through these (previously undiscoverable, at least to me!)
URLs that serve opaque data structures.
Like all of the examples here, these URLs were not found through web search -
they were just in the LLM's world knowledge. Yes, that's right - the LLMs
just know about these URLs that look like this:
https://www.ndbc.noaa.gov/data/realtime2/{station_id}.txt and know
that the station I'm interested in is probably 46026.
"https://www.ndbc.noaa.gov/data/realtime2/{station_id}.txt") and
station number (46026) was not provided by me nor discovered in web search - it was
remarkably just part of the LLM's world knowledge. As was the knowledge about the data structure
and how to parse it.
311 Civic Data
311 data - the city complaint hotline - is a treasure-trove of data and is remarkably accessible and well known by LLMs.
One of my favorite queries is to look up recent graffiti complaints in the city as a little underground art tour (one citizen's graffiti complaint is another citizen's masterpiece!).
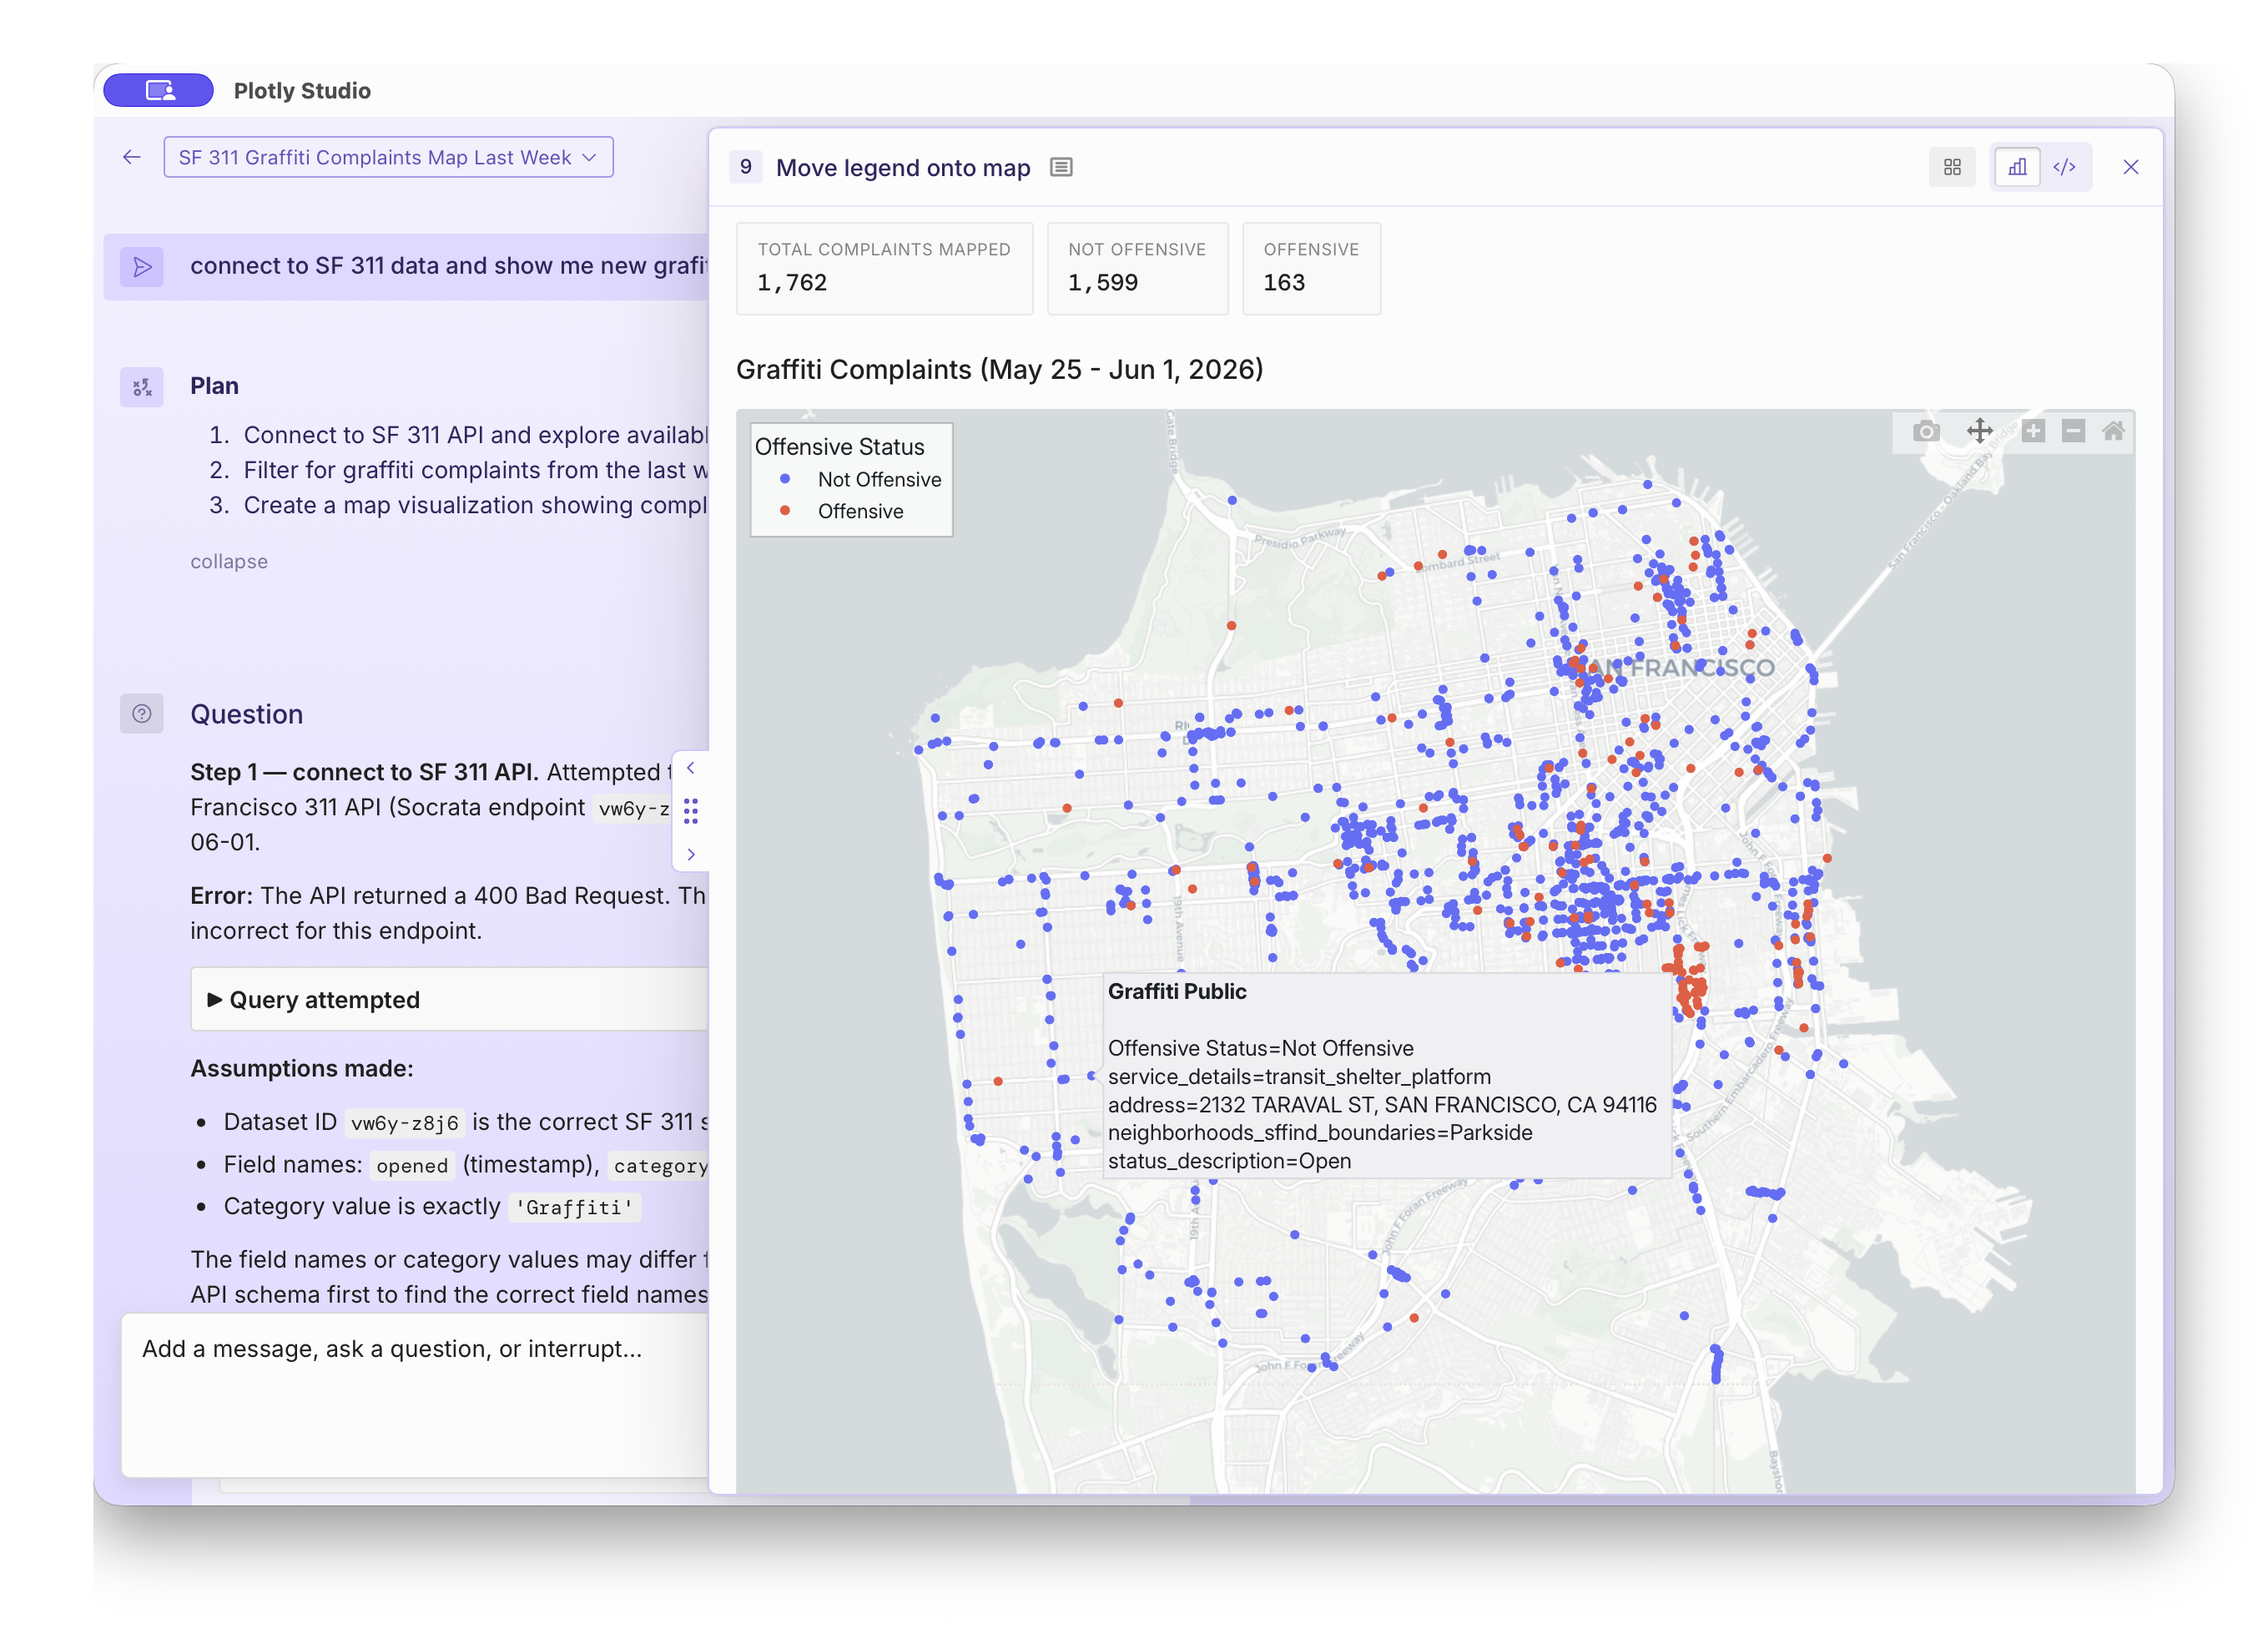
https://data.sfgov.org/resource/vw6y-z8j6.json
Another remarkable example of the obscure world knowledge in LLMs -
`vw6y-z8j6.json` is not a common URL pathname!
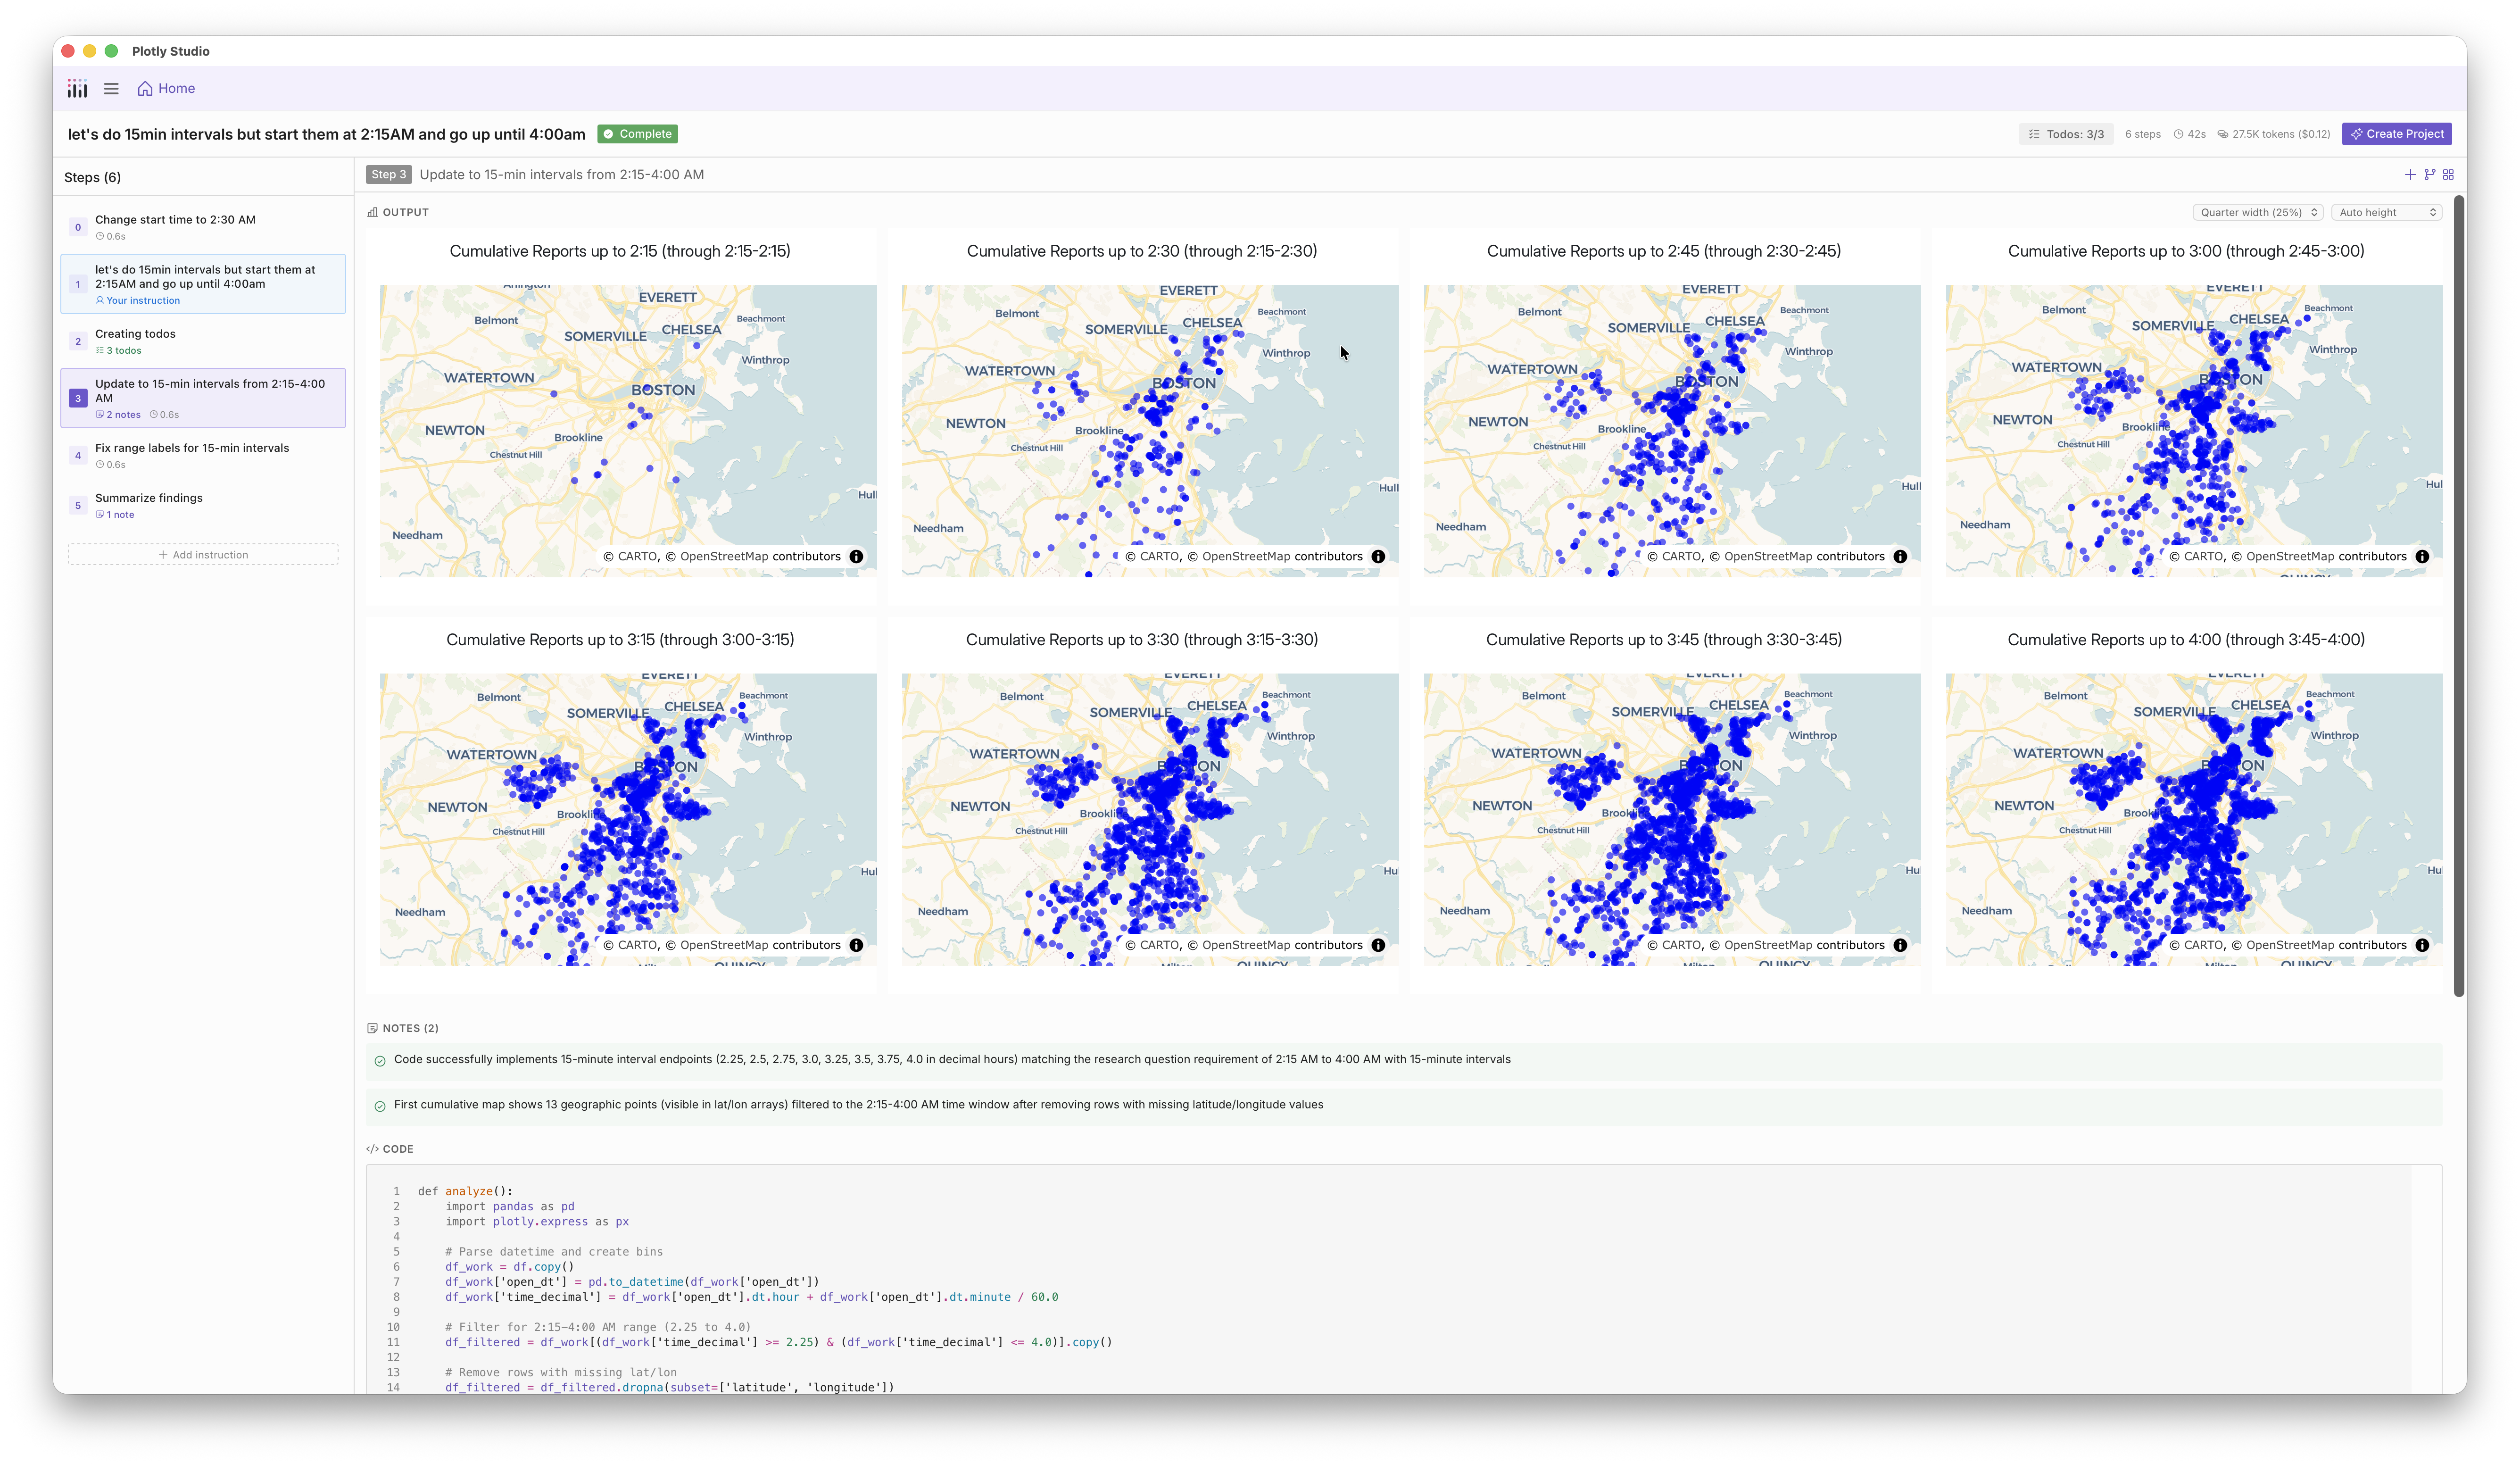
311 data is available in most major cities. In preparing for a talk I gave in Boston, I plotted the trajectory of the snow storm of the season by tracking 311 complaints about snow.
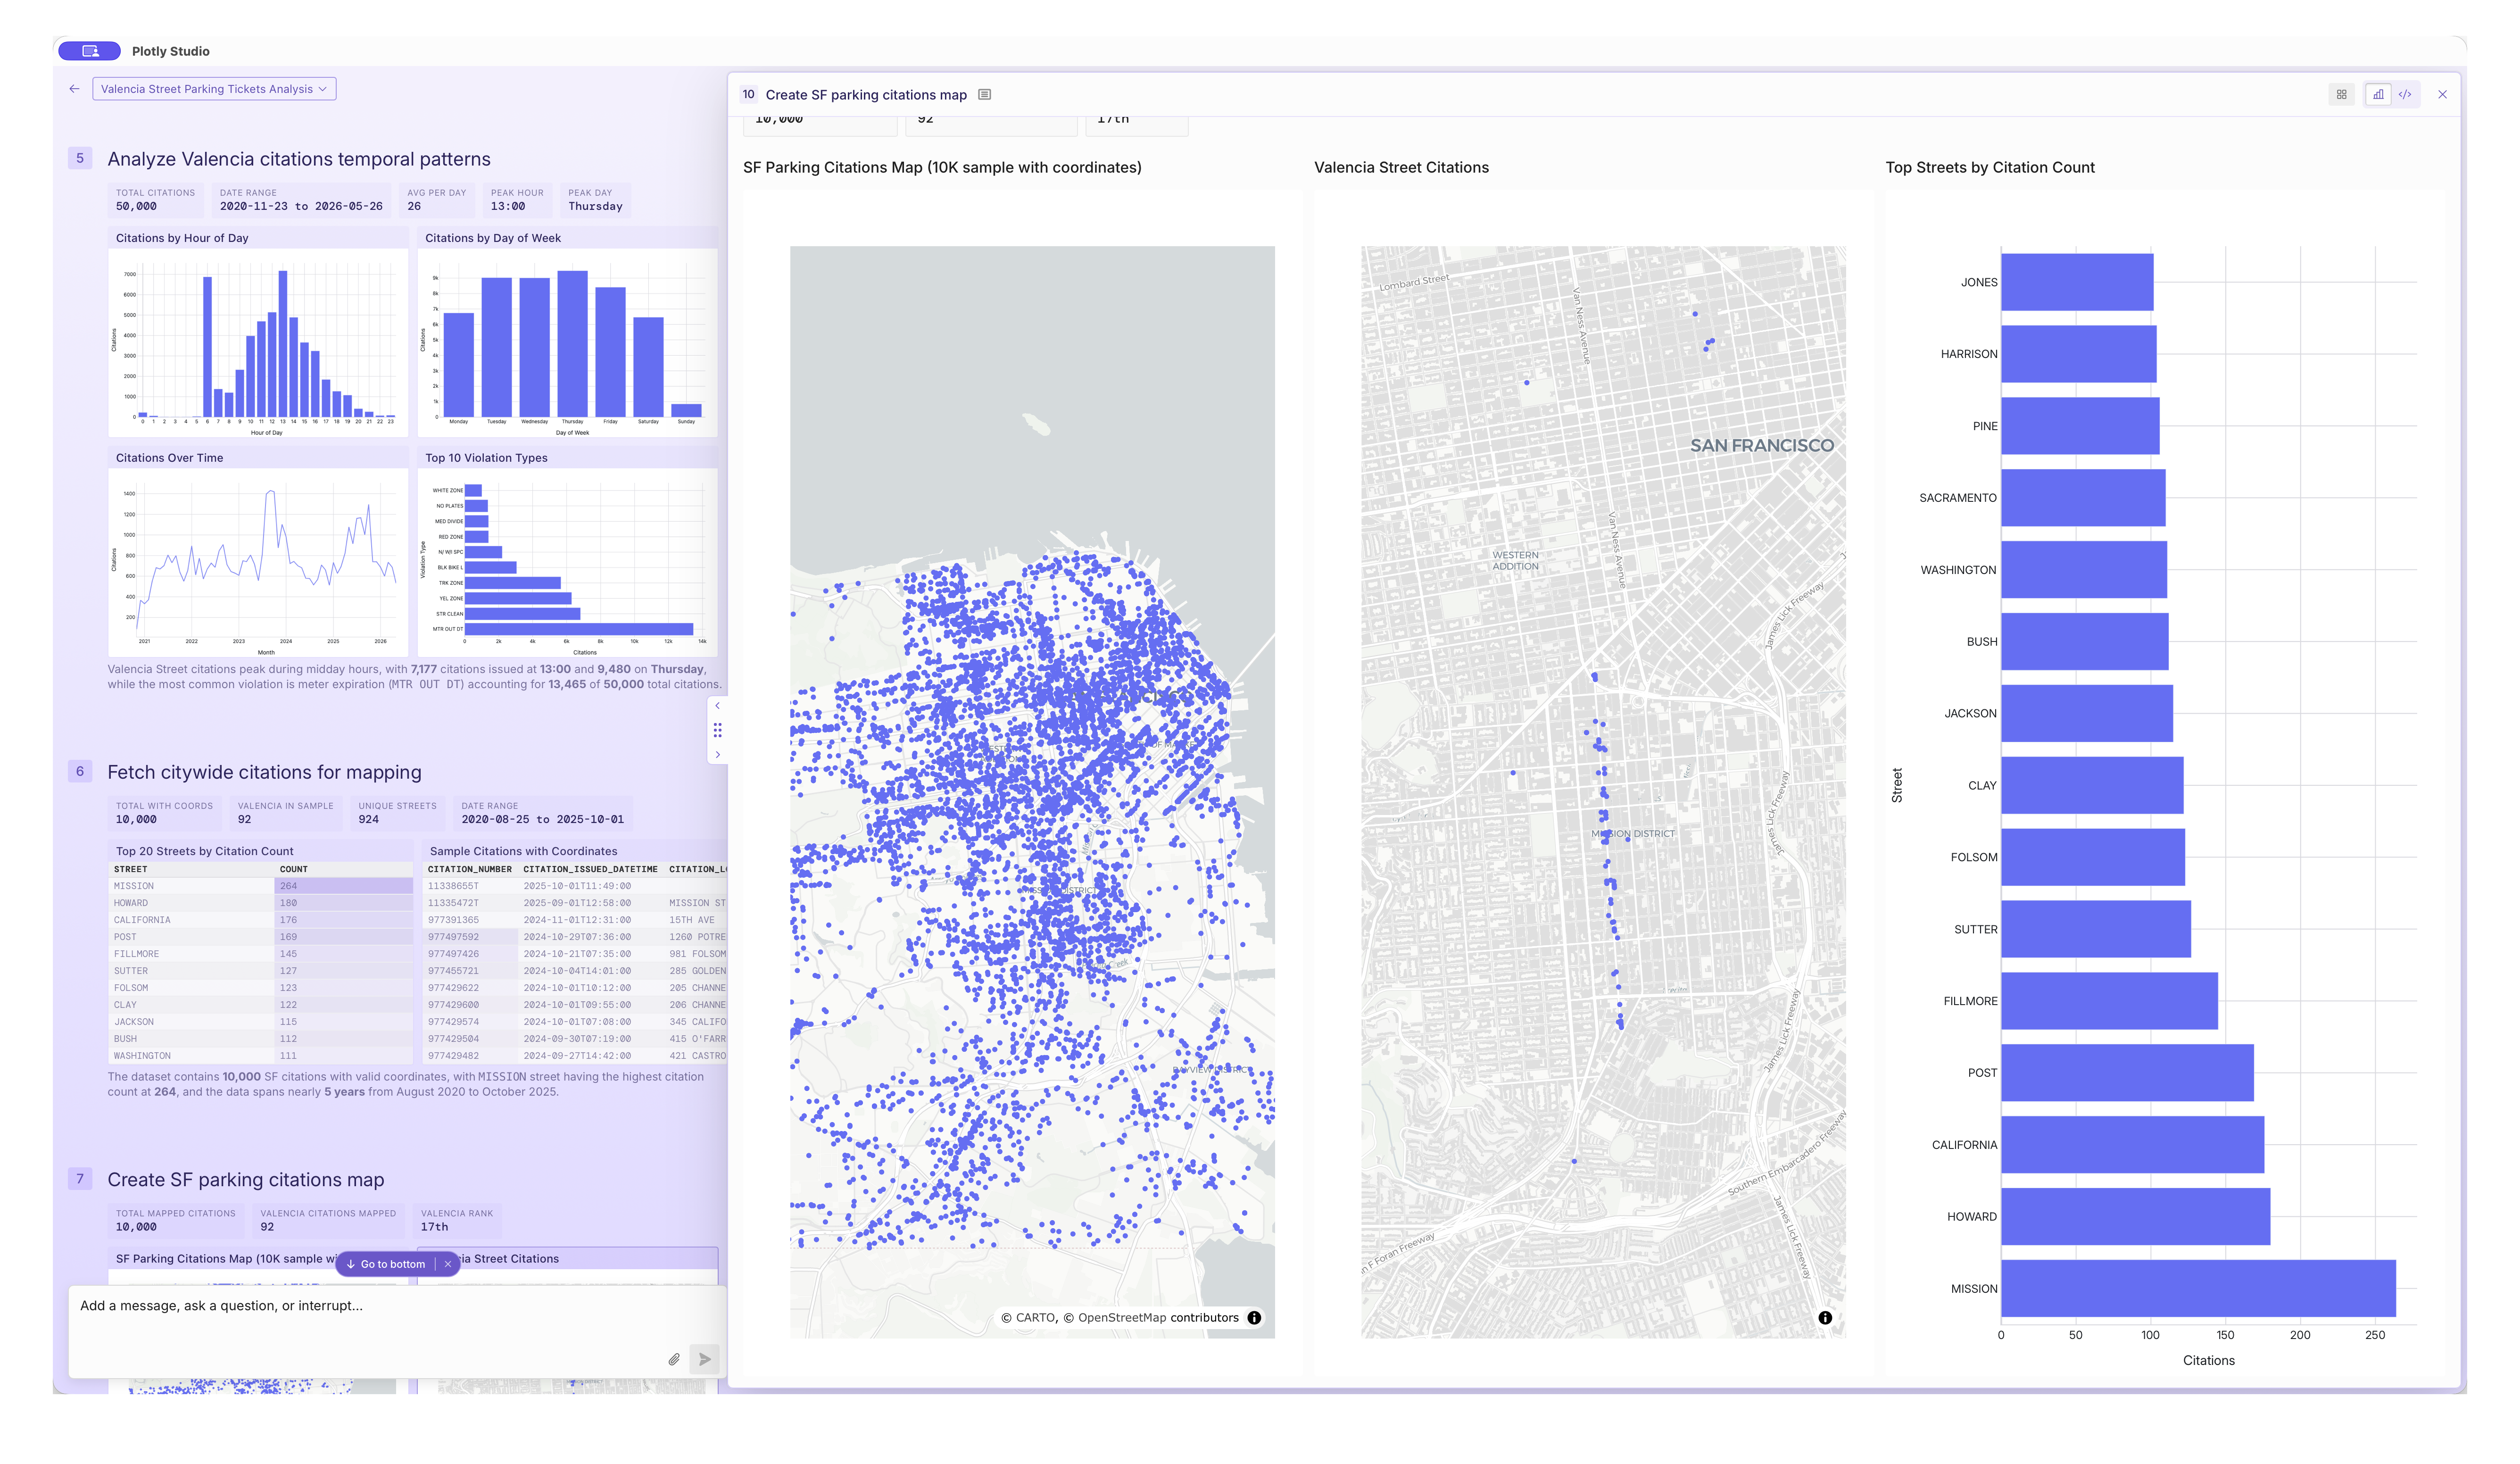
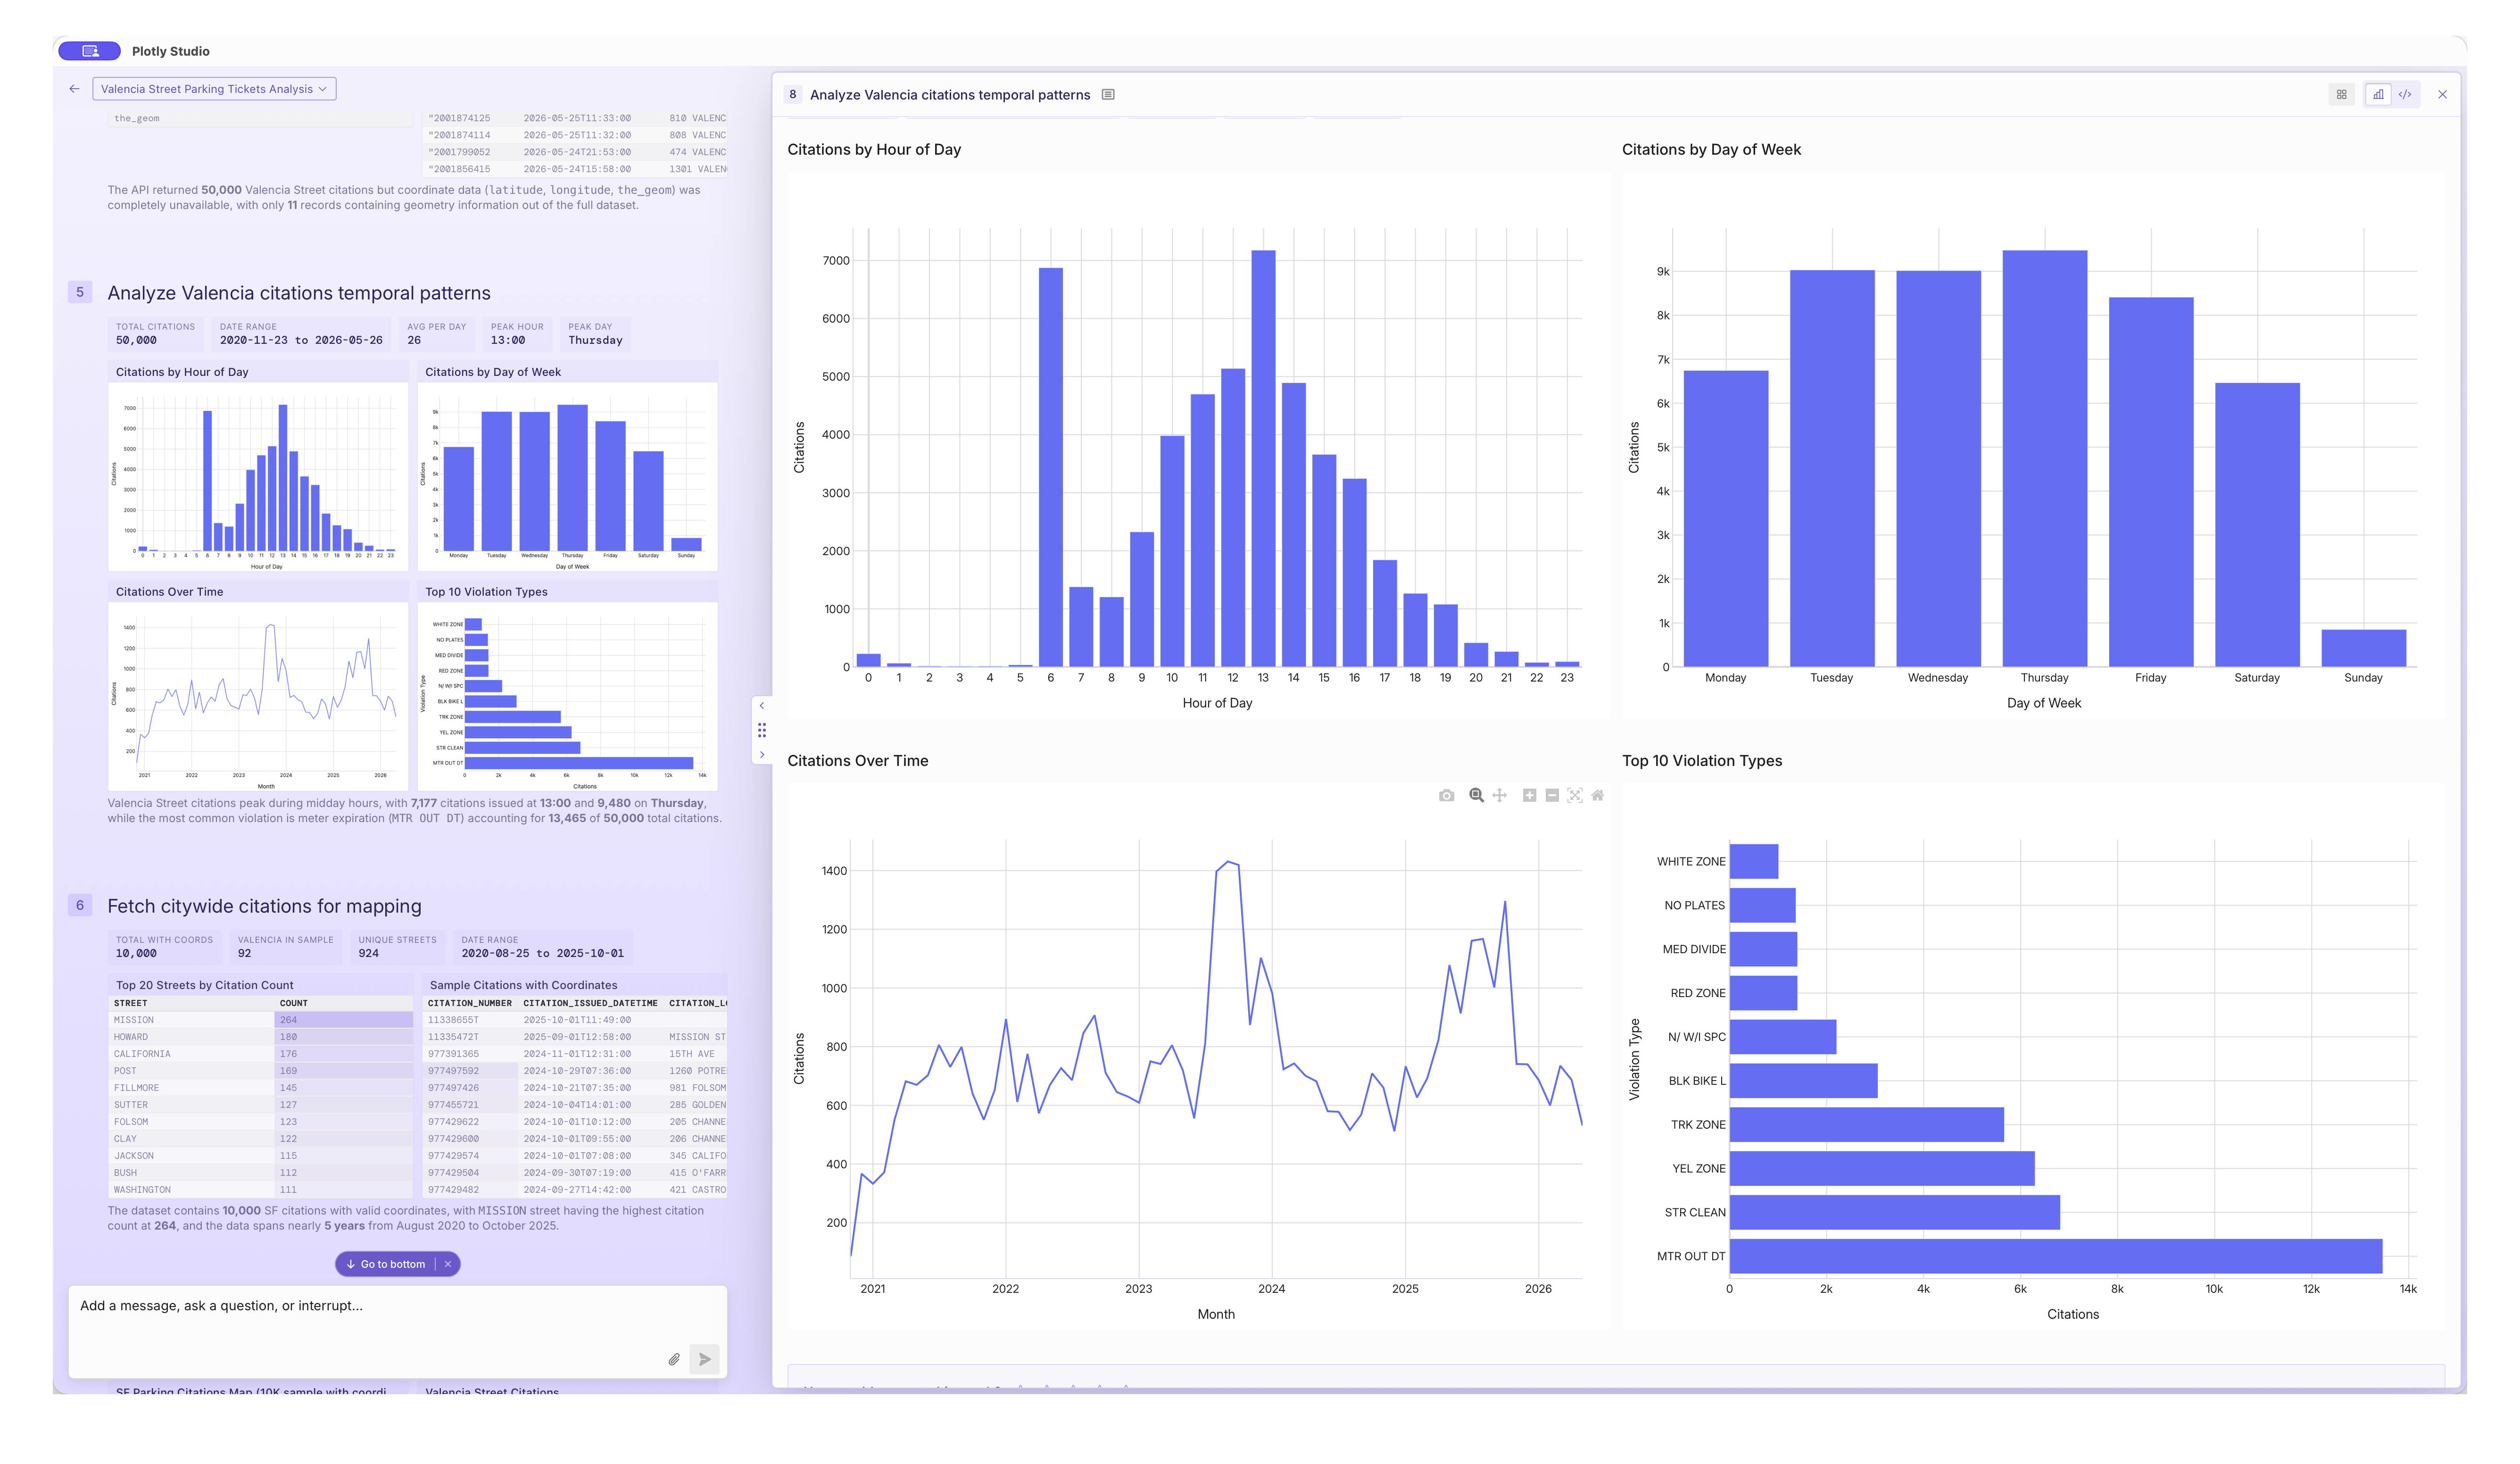
At a recent SF meetup, we wondered how likely our cars parked on Valencia St would be to get a parking ticket or not:
Macro Economic Data
The Federal Reserve of St Louis ("FRED") posts a ridiculous number of public economics data about seemingly every subject.
The series names are logical but highly specific, and today's frontier models almost
know them all (and for what they don't know, they are aware of FRED's excellent search API).
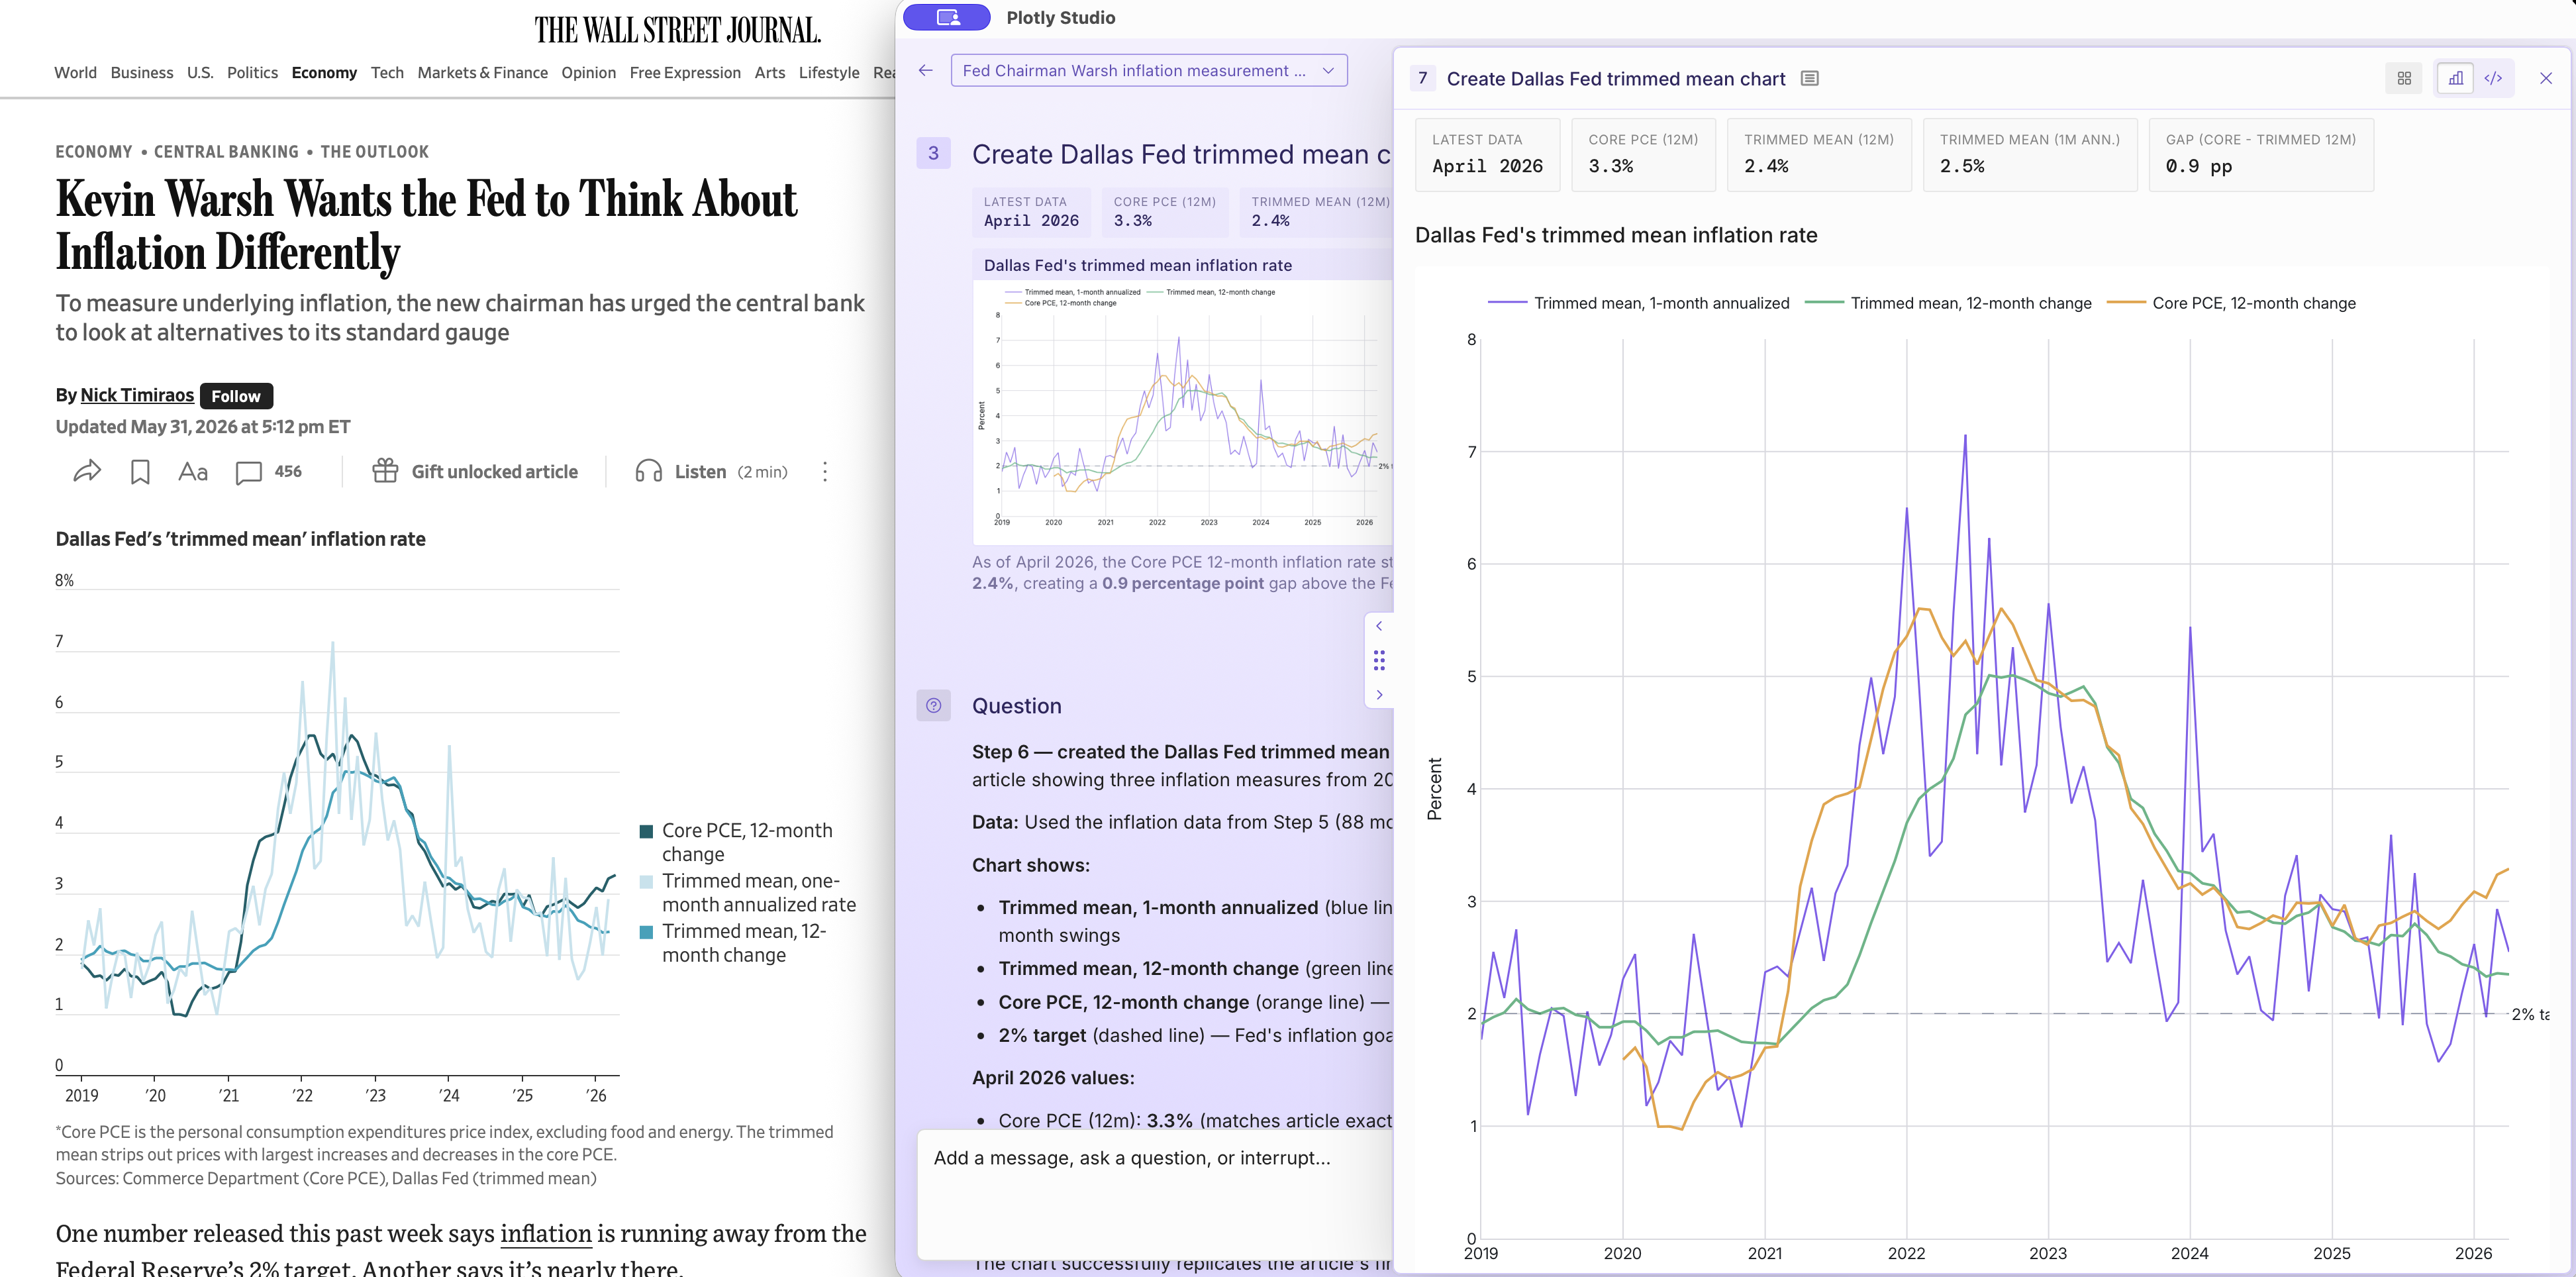
Can you guess what seriesPCETRIM6M680SFRBDAL stands for?
("Dallas Fed's 6-month annualized trimmed mean PCE inflation rate")
I've developed an odd hobby of asking Studio to fetch data to back up (or counter-act) headlines from newspapers like the Wall Street Journal. As data people we have a particular disdain for the editorial and a fantasy for finding "the real answer" in the data. It's invigorating!
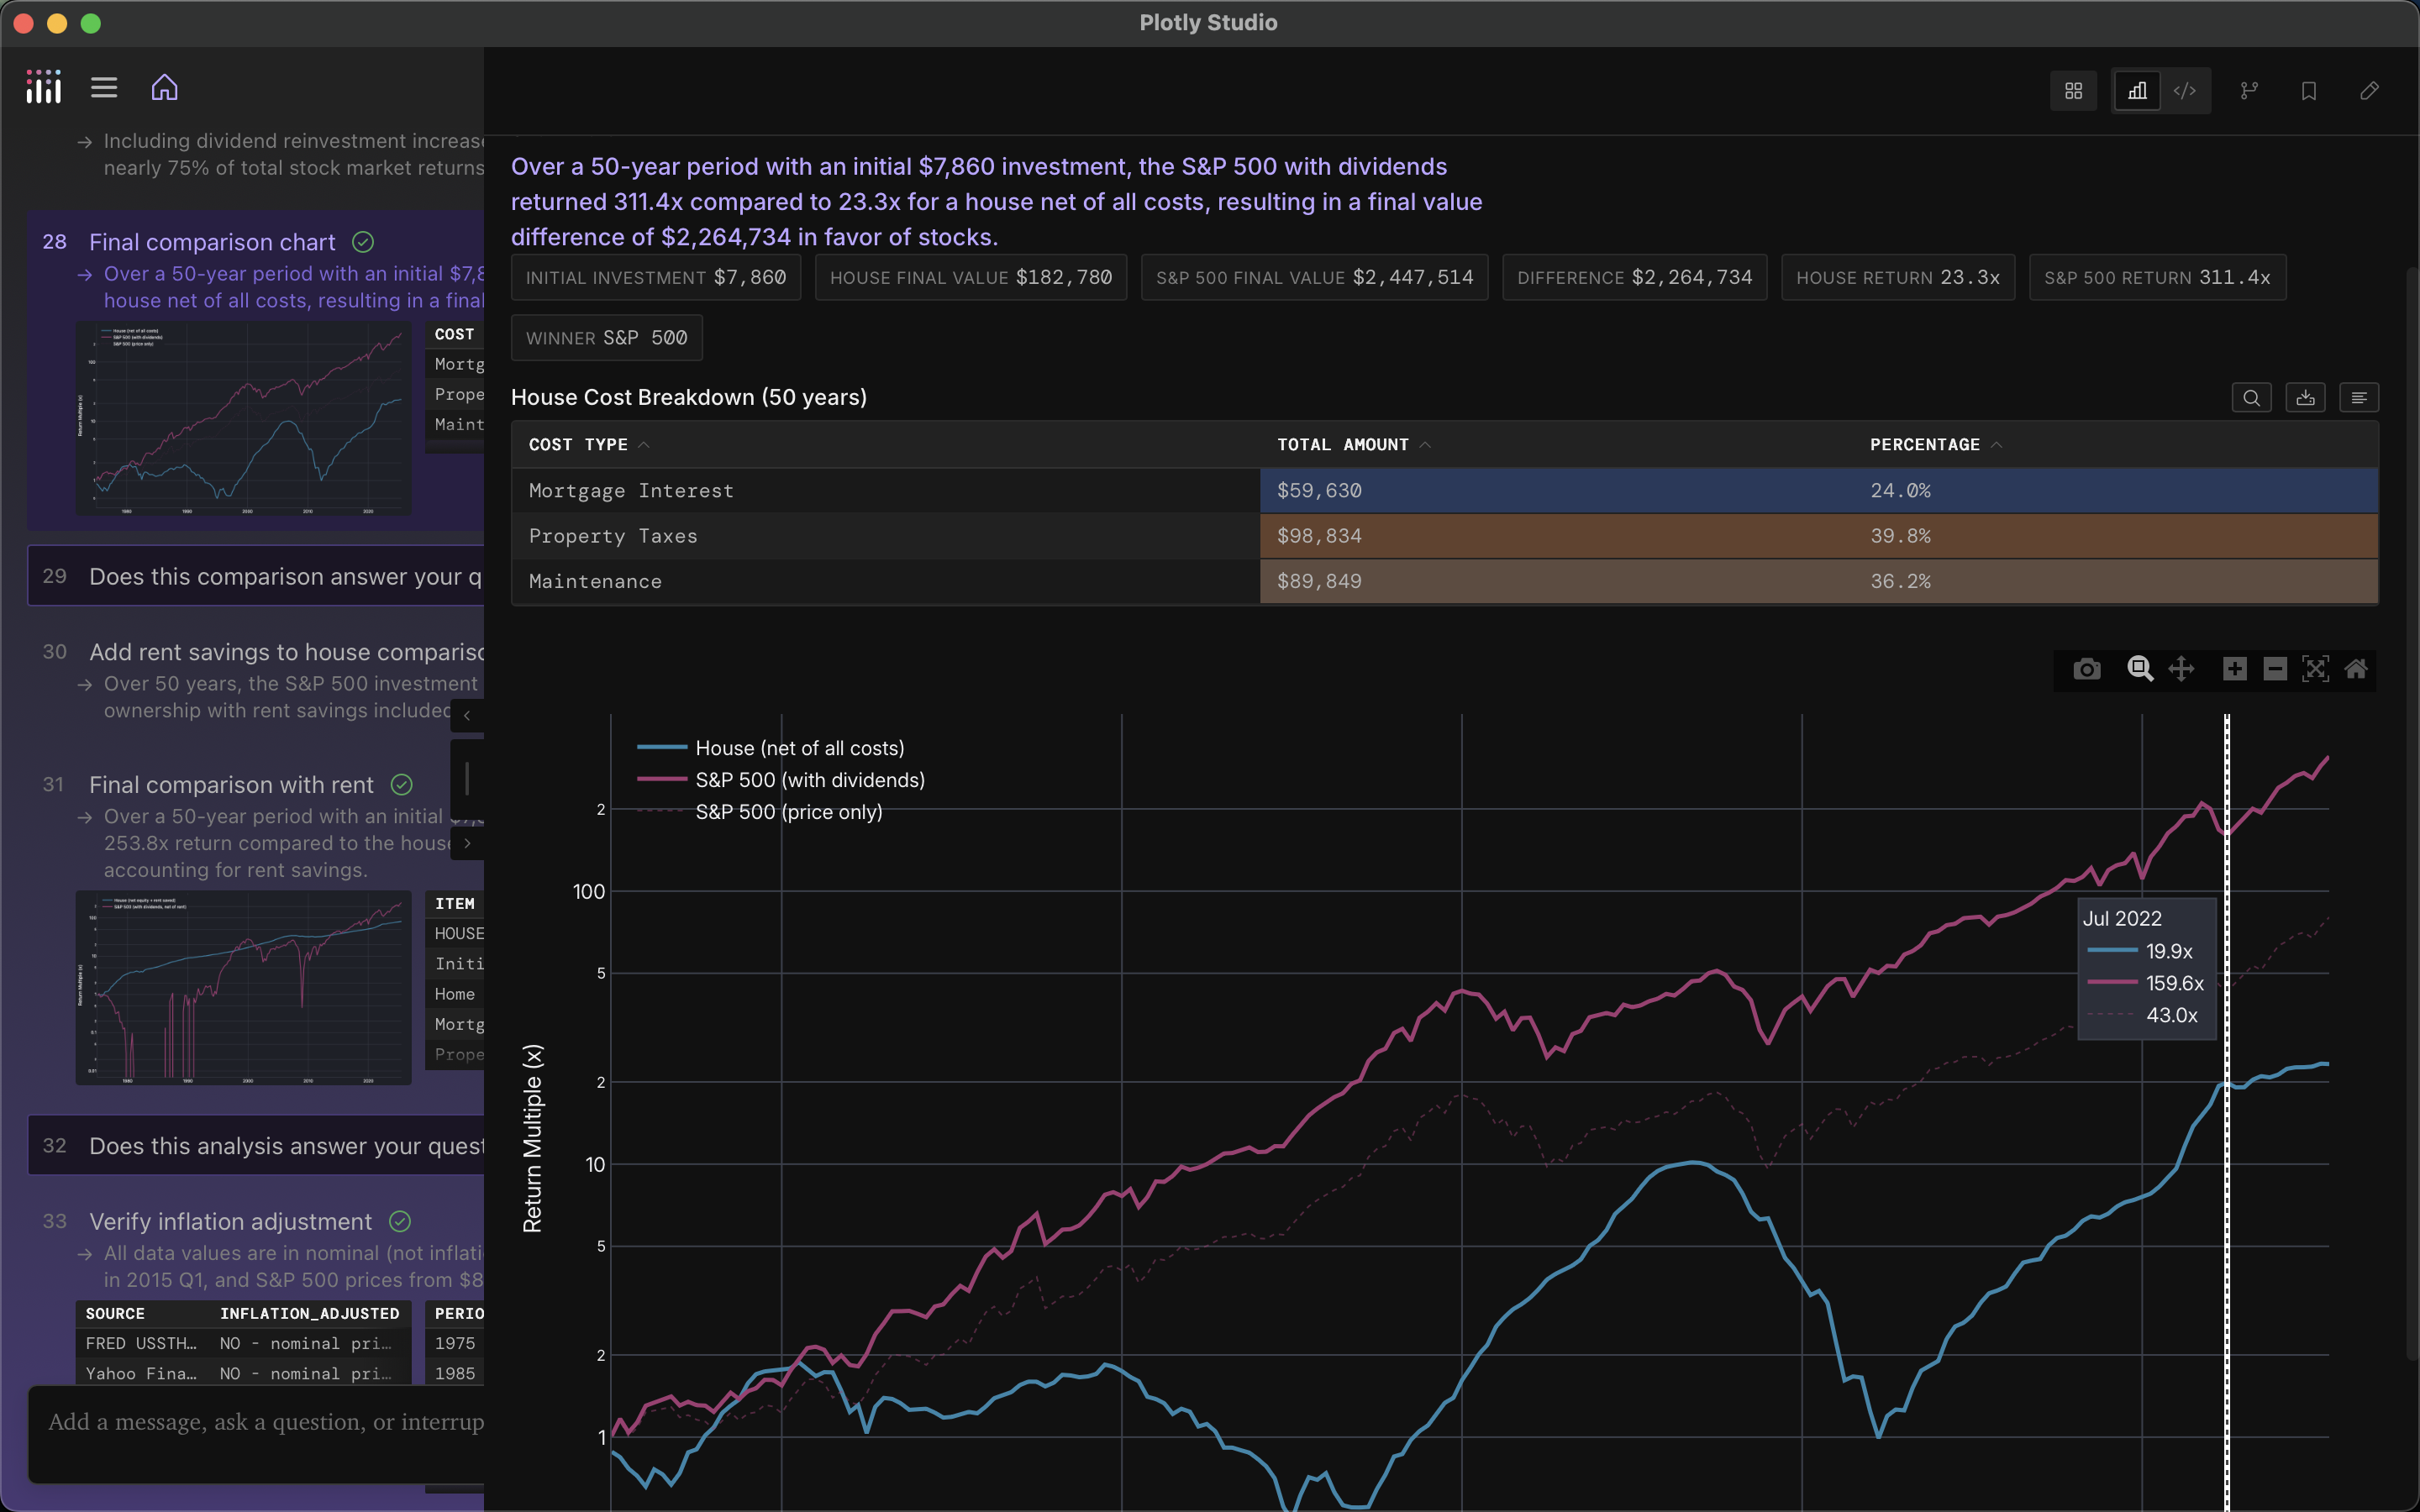
And asking about broad macro economic questions, like real rent-vs-buy data comparing the houses that my parents bought 30 years ago to housing today.
An AI grounded in data
There is a lot of discourse about how LLMs "average out" the content on the web due to their very nature. That the web is full of small and funky corners with interesting takes and viewpoints is at risk of collapsing as we interface solely through the everything apps.
I don't disagree. But in this corner of the world of data, I've been delighted to find LLMs surface data sources through obscure APIs that I would have never found, let alone knew they existed in the first place.
And the best part is that it's data. Cold, hard, often primary and hopefully trustworthy data. Data that you can examine and graph and interpret and draw your own conclusions to - without any LLM editorializing or smoothing over its point of view or doing the thinking and analysis for you.
What an invigorating and refreshing way to interface with the world and these new machines.
So what other data sources are out there? What have you always wondered about but never had the data on hand? Let me know and get in touch.