
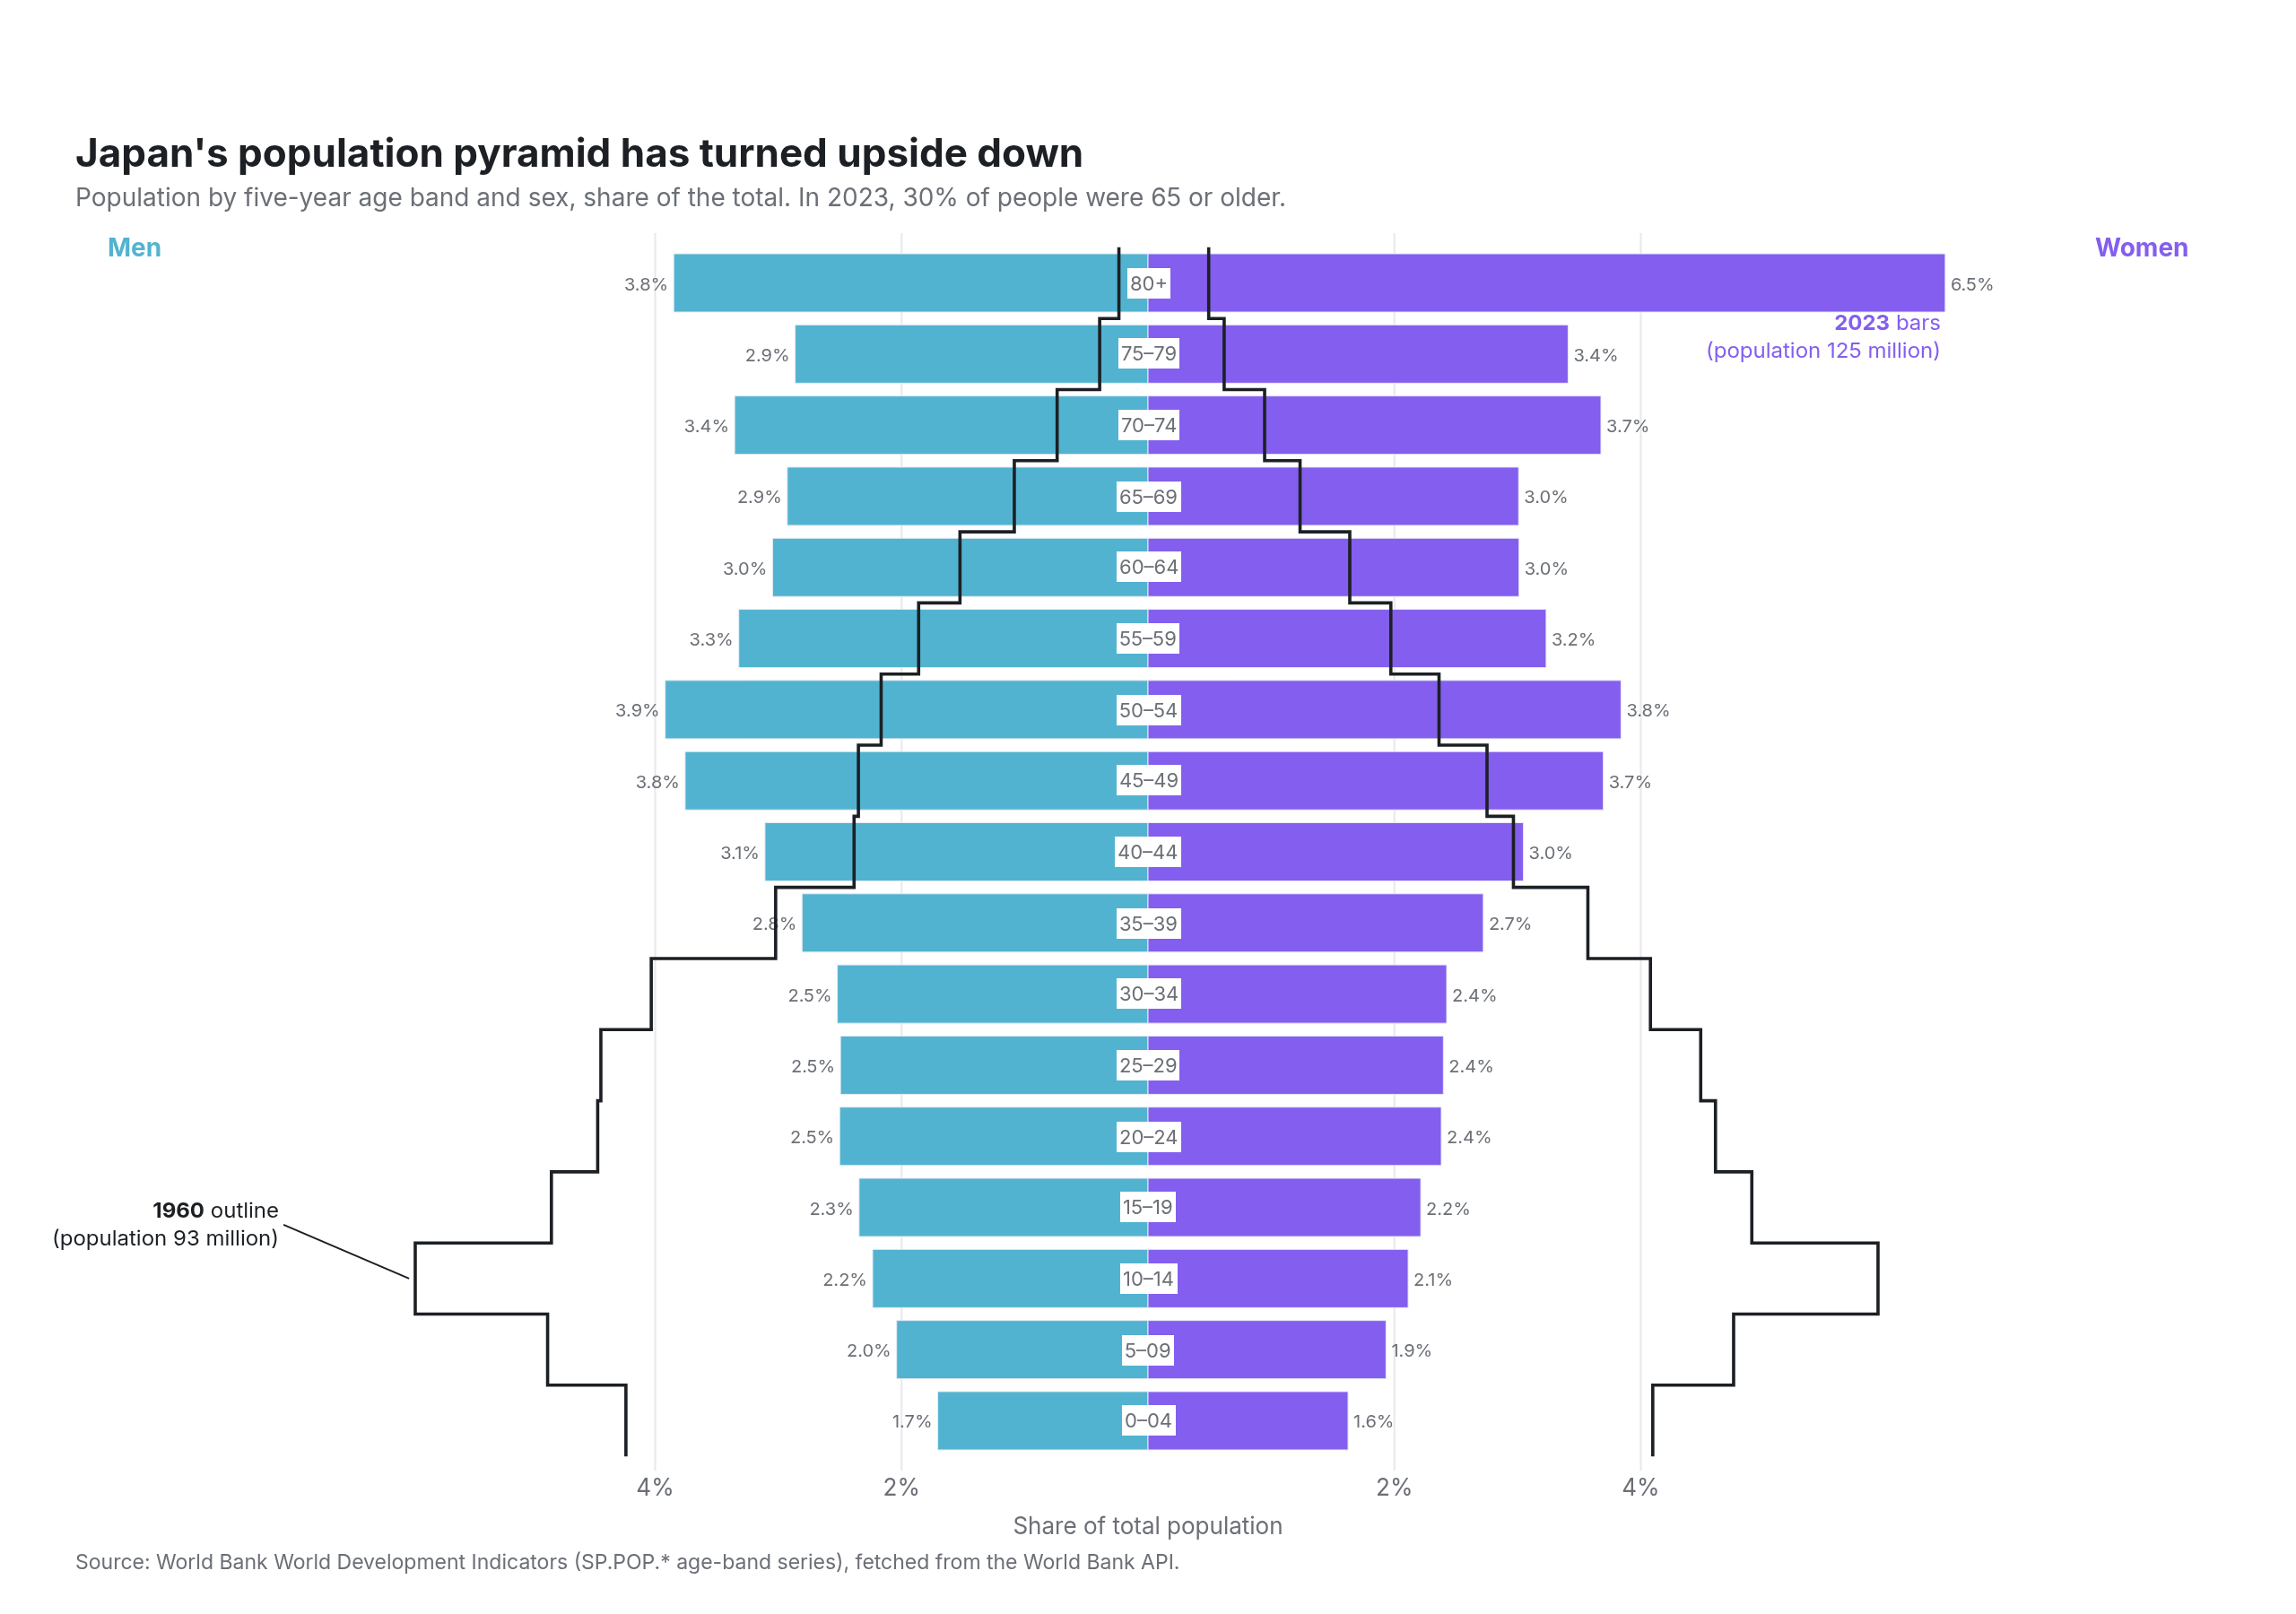
Population pyramid
Japan, 1960 against 2023, from the World Bank API
Example from Plotly for highly customizable print-ready data visualization · shared helpers
Python Code
"""Population pyramid — Japan, 1960 against 2023, from the World Bank API.

The Pew Research treatment: 2023 as solid bars, 1960 as an outline laid over
them, men to the left and women to the right of a shared centre line, with
the age bands labelled once down the middle instead of on a y axis.
"""
from pathlib import Path

from _shared import fetch_json, save, base_layout, titles, INK, MUTED, FAINT, GRID, VIOLET, TEAL, hex_to_rgba

import numpy as np
import plotly.graph_objects as go

CHART_NUM = 10
BANDS = ["0004", "0509", "1014", "1519", "2024", "2529", "3034", "3539", "4044", "4549", "5054",
         "5559", "6064", "6569", "7074", "7579", "80UP"]
LABELS = [f"{b[:2].lstrip('0') or '0'}–{b[2:]}" for b in BANDS[:-1]] + ["80+"]
Y0, Y1 = 1960, 2023
COUNTRY = "JPN"


def wb(indicator: str) -> dict:
    url = f"https://api.worldbank.org/v2/country/{COUNTRY}/indicator/{indicator}?format=json&per_page=200"
    rows = fetch_json(url)[1]
    return {int(r["date"]): r["value"] for r in rows if r["value"] is not None}


def generate():
    data = {}
    for sex in ("MA", "FE"):
        for band in BANDS:
            data[(sex, band)] = wb(f"SP.POP.{band}.{sex}")
    men = {yr: np.array([data[("MA", b)][yr] for b in BANDS]) for yr in (Y0, Y1)}
    women = {yr: np.array([data[("FE", b)][yr] for b in BANDS]) for yr in (Y0, Y1)}
    total = {yr: men[yr].sum() + women[yr].sum() for yr in (Y0, Y1)}
    pm = {yr: men[yr] / total[yr] * 100 for yr in (Y0, Y1)}
    pw = {yr: women[yr] / total[yr] * 100 for yr in (Y0, Y1)}

    fig = go.Figure()
    y = np.arange(len(BANDS))
    fig.add_trace(go.Bar(y=y, x=-pm[Y1], orientation="h", name=f"Men {Y1}", marker=dict(color=TEAL), width=0.82,
                         hovertemplate="Men %{customdata}: %{x:.1f}%<extra>" + str(Y1) + "</extra>", customdata=LABELS,
                         text=[f"{v:.1f}" for v in pm[Y1]], textposition="outside", textfont=dict(size=10, color=MUTED), texttemplate="%{text}%"))
    fig.add_trace(go.Bar(y=y, x=pw[Y1], orientation="h", name=f"Women {Y1}", marker=dict(color=VIOLET), width=0.82,
                         hovertemplate="Women %{customdata}: %{x:.1f}%<extra>" + str(Y1) + "</extra>", customdata=LABELS,
                         text=[f"{v:.1f}" for v in pw[Y1]], textposition="outside", textfont=dict(size=10, color=MUTED), texttemplate="%{text}%"))
    # 1960 as a stepped outline over the bars.
    def outline(vals, sign):
        xs, ys = [], []
        for i, v in enumerate(vals):
            xs += [sign * v, sign * v]
            ys += [i - 0.5, i + 0.5]
        return xs, ys
    for vals, sign in ((pm[Y0], -1), (pw[Y0], 1)):
        xs, ys = outline(vals, sign)
        fig.add_trace(go.Scatter(x=xs, y=ys, mode="lines", line=dict(color=INK, width=1.8, shape="linear"),
                                 name=f"{Y0}", hoverinfo="skip", showlegend=False))
    for i, lab in enumerate(LABELS):
        fig.add_annotation(x=0, y=i, text=lab, showarrow=False, font=dict(size=11, color=MUTED), bgcolor="white", borderpad=1)

    xmax = max(pm[Y0].max(), pw[Y0].max(), pm[Y1].max(), pw[Y1].max()) * 1.35
    fig.update_layout(**base_layout(barmode="overlay", bargap=0.1, margin=dict(l=40, r=40, t=130, b=80)))
    fig.update_xaxes(range=[-xmax, xmax], tickvals=[-4, -2, 2, 4], ticktext=["4%", "2%", "2%", "4%"], showgrid=True, zeroline=False,
                     title_text="Share of total population")
    fig.update_yaxes(visible=False, range=[-0.7, len(BANDS) - 0.3])
    fig.add_annotation(x=-xmax * 0.97, y=len(BANDS) - 0.5, text=f"<b>Men</b>", showarrow=False, xanchor="left", font=dict(size=14, color=TEAL))
    fig.add_annotation(x=xmax * 0.97, y=len(BANDS) - 0.5, text=f"<b>Women</b>", showarrow=False, xanchor="right", font=dict(size=14, color=VIOLET))
    fig.add_annotation(x=-pm[Y0][2] - 0.05, y=2, text=f"<b>{Y0}</b> outline<br>(population {total[Y0] / 1e6:.0f} million)", showarrow=True, arrowhead=0,
                       arrowcolor=INK, ax=-70, ay=-30, xanchor="right", font=dict(size=12, color=INK), align="right")
    fig.add_annotation(x=pw[Y1][16], y=16, text=f"<b>{Y1}</b> bars<br>(population {total[Y1] / 1e6:.0f} million)", showarrow=False,
                       yshift=-30, xanchor="right", font=dict(size=12, color=VIOLET), align="right")
    older = (men[Y1][13:].sum() + women[Y1][13:].sum()) / total[Y1] * 100
    titles(fig, "Japan's population pyramid has turned upside down",
           f"Population by five-year age band and sex, share of the total. In {Y1}, {older:.0f}% of people were 65 or older.",
           "Source: World Bank World Development Indicators (SP.POP.* age-band series), fetched from the World Bank API.")
    save(CHART_NUM, fig, width=1280, height=900)
Made with Plotly