
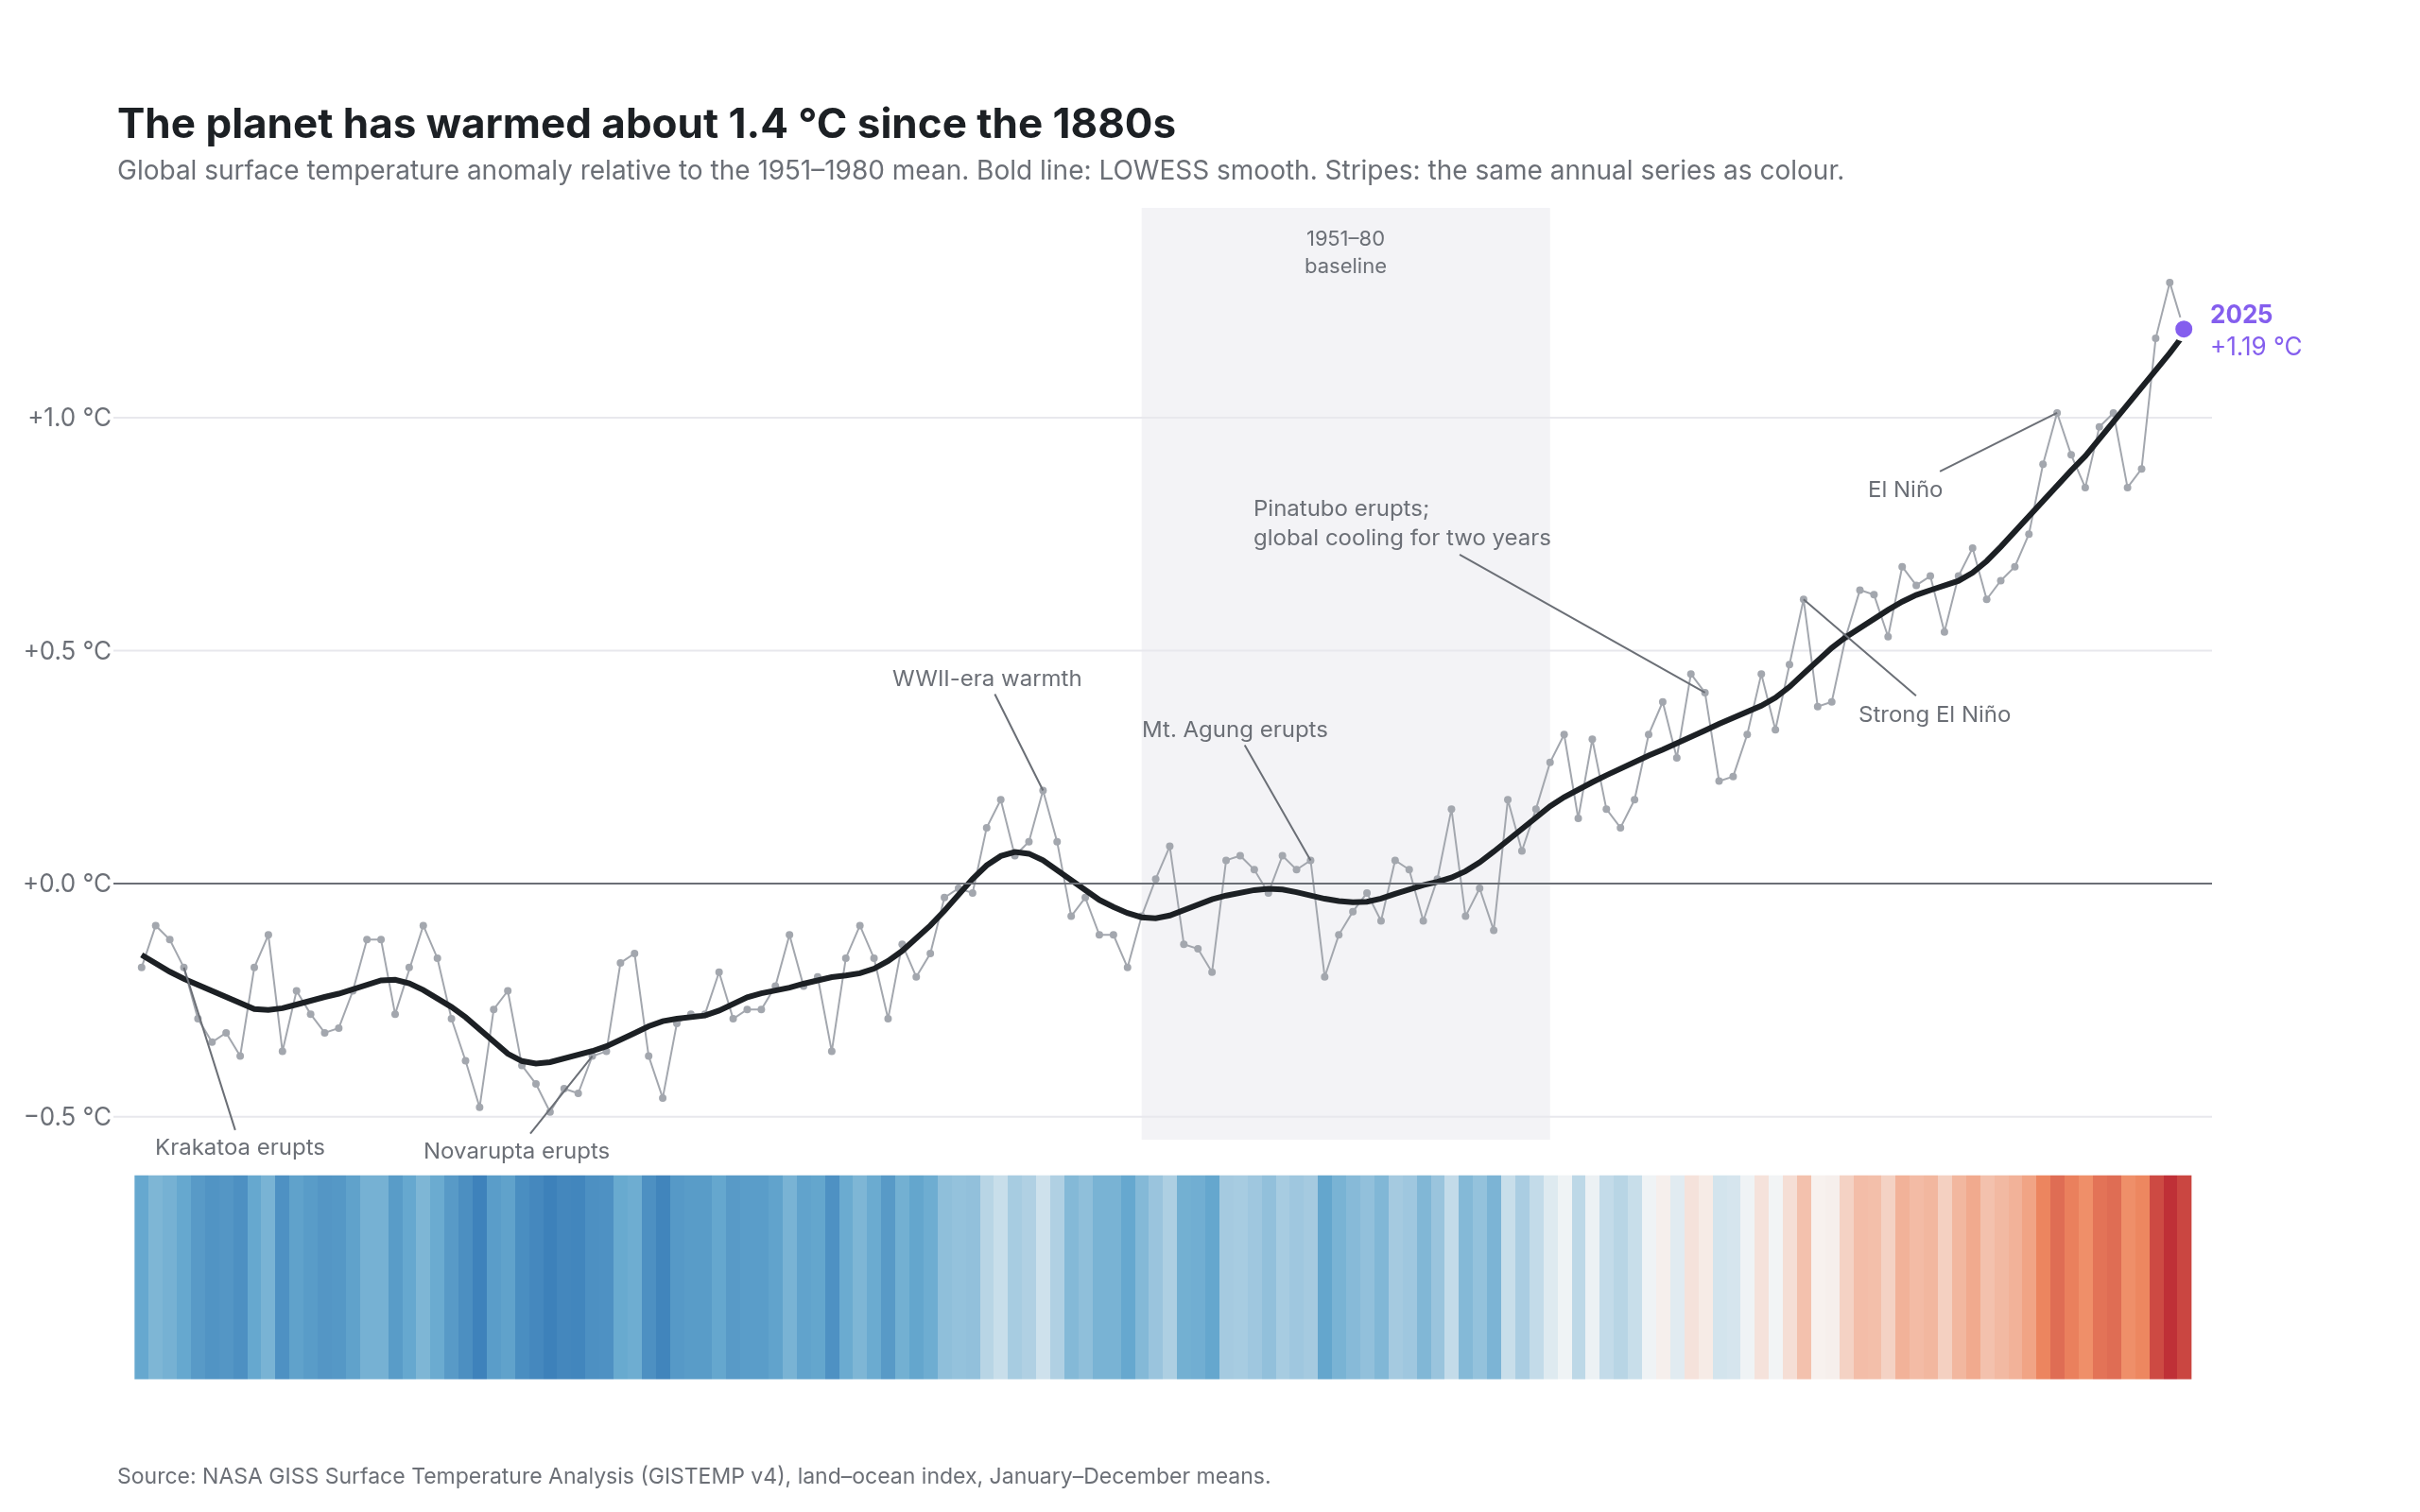
Annotated line with warming stripes
NASA GISTEMP global mean, 1880–2025
Example from Plotly for highly customizable print-ready data visualization · shared helpers
Python Code
"""Annotated line with warming stripes — NASA GISTEMP global mean, 1880–2025.

The newspaper treatment: a thin annual series under a bold smoothed one,
events called out with hairline leaders, the last value labelled, and the
same series repeated as warming stripes underneath so the two encodings
read against each other.
"""
from pathlib import Path

from _shared import fetch_text, save, base_layout, titles, INK, MUTED, FAINT, GRID, RDBU, VIOLET

import io
import numpy as np
import pandas as pd
import plotly.graph_objects as go
from plotly.subplots import make_subplots

CHART_NUM = 1
URL = "https://data.giss.nasa.gov/gistemp/tabledata_v4/GLB.Ts+dSST.csv"

EVENTS = [
    (1883, "Krakatoa erupts", 30, 95),
    (1912, "Novarupta erupts", -40, 50),
    (1944, "WWII-era warmth", -30, -60),
    (1963, "Mt. Agung erupts", -40, -70),
    (1991, "Pinatubo erupts;\nglobal cooling for two years", -160, -90),
    (1998, "Strong El Niño", 70, 60),
    (2016, "El Niño", -80, 40),
]


def lowess(x, y, frac=0.12):
    """Tiny LOWESS (tricube-weighted local linear fit) — enough for a smooth."""
    x, y = np.asarray(x, float), np.asarray(y, float)
    n, k = len(x), int(np.ceil(frac * len(x)))
    out = np.empty(n)
    for i in range(n):
        d = np.abs(x - x[i])
        h = np.sort(d)[k - 1]
        w = np.clip(1 - (d / h) ** 3, 0, 1) ** 3
        A = np.vstack([np.ones(n), x - x[i]]).T * w[:, None]
        beta = np.linalg.lstsq(A, y * w, rcond=None)[0]
        out[i] = beta[0]
    return out


def generate():
    raw = fetch_text(URL)
    df = pd.read_csv(io.StringIO(raw), skiprows=1, na_values="***")
    df = df[["Year", "J-D"]].dropna()
    years, anom = df["Year"].to_numpy(), df["J-D"].to_numpy(float)
    smooth = lowess(years, anom)

    fig = make_subplots(rows=2, cols=1, shared_xaxes=True, row_heights=[0.82, 0.18],
                        vertical_spacing=0.03)

    # Warming stripes: one heatmap row, annual anomaly, no axes.
    fig.add_trace(go.Heatmap(
        z=[anom], x=years, y=[0], colorscale=RDBU, zmid=0, zmin=-0.7, zmax=1.4,
        showscale=False, hovertemplate="%{x}: %{z:+.2f} °C<extra></extra>",
    ), row=2, col=1)

    # Annual values: hairline with small points; smooth: bold.
    fig.add_trace(go.Scatter(
        x=years, y=anom, mode="lines+markers", name="Annual",
        line=dict(color=FAINT, width=1), marker=dict(size=4, color=FAINT),
        hovertemplate="%{x}: %{y:+.2f} °C<extra></extra>",
    ), row=1, col=1)
    fig.add_trace(go.Scatter(
        x=years, y=smooth, mode="lines", name="Smoothed",
        line=dict(color=INK, width=3),
        hoverinfo="skip",
    ), row=1, col=1)

    # Last value: a filled dot and a label on the right.
    fig.add_trace(go.Scatter(
        x=[years[-1]], y=[anom[-1]], mode="markers",
        marker=dict(size=11, color=VIOLET, line=dict(color="white", width=2)),
        hoverinfo="skip",
    ), row=1, col=1)
    fig.add_annotation(
        x=years[-1], y=anom[-1], xref="x", yref="y", text=f"<b>{years[-1]}</b><br>{anom[-1]:+.2f} °C",
        showarrow=False, xanchor="left", xshift=12, font=dict(size=13, color=VIOLET), align="left",
    )

    # Event callouts with hairline leaders.
    for yr, label, ax, ay in EVENTS:
        i = int(np.where(years == yr)[0][0])
        fig.add_annotation(
            x=yr, y=anom[i], xref="x", yref="y", text=label.replace("\n", "<br>"),
            showarrow=True, arrowhead=0, arrowwidth=1, arrowcolor=MUTED,
            ax=ax, ay=ay, font=dict(size=12, color=MUTED), align="left",
        )

    # Baseline period band and zero line.
    fig.add_shape(type="rect", x0=1951, x1=1980, y0=-0.55, y1=1.45, xref="x", yref="y",
                  fillcolor=GRID, opacity=0.5, line_width=0, layer="below")
    fig.add_annotation(x=1965.5, y=1.42, xref="x", yref="y", text="1951–80<br>baseline",
                       showarrow=False, font=dict(size=11, color=MUTED), yanchor="top")
    fig.add_hline(y=0, line=dict(color=MUTED, width=1), row=1, col=1)

    layout = base_layout(margin=dict(l=60, r=110, t=110, b=70))
    fig.update_layout(**layout)
    fig.update_xaxes(showgrid=False, dtick=20, range=[1878, 2027], row=1, col=1)
    fig.update_xaxes(showgrid=False, showticklabels=False, range=[1878, 2027], row=2, col=1)
    fig.update_yaxes(ticksuffix=" °C", tickformat="+.1f", range=[-0.55, 1.45], dtick=0.5, row=1, col=1)
    fig.update_yaxes(showgrid=False, showticklabels=False, row=2, col=1)
    fig.update_layout(xaxis2=dict(showgrid=False))

    rise = smooth[-1] - smooth[:10].mean()
    titles(fig,
           f"The planet has warmed about {rise:.1f} °C since the 1880s",
           "Global surface temperature anomaly relative to the 1951–1980 mean. Bold line: LOWESS smooth. Stripes: the same annual series as colour.",
           "Source: NASA GISS Surface Temperature Analysis (GISTEMP v4), land–ocean index, January–December means.")
    save(CHART_NUM, fig)
Made with Plotly