
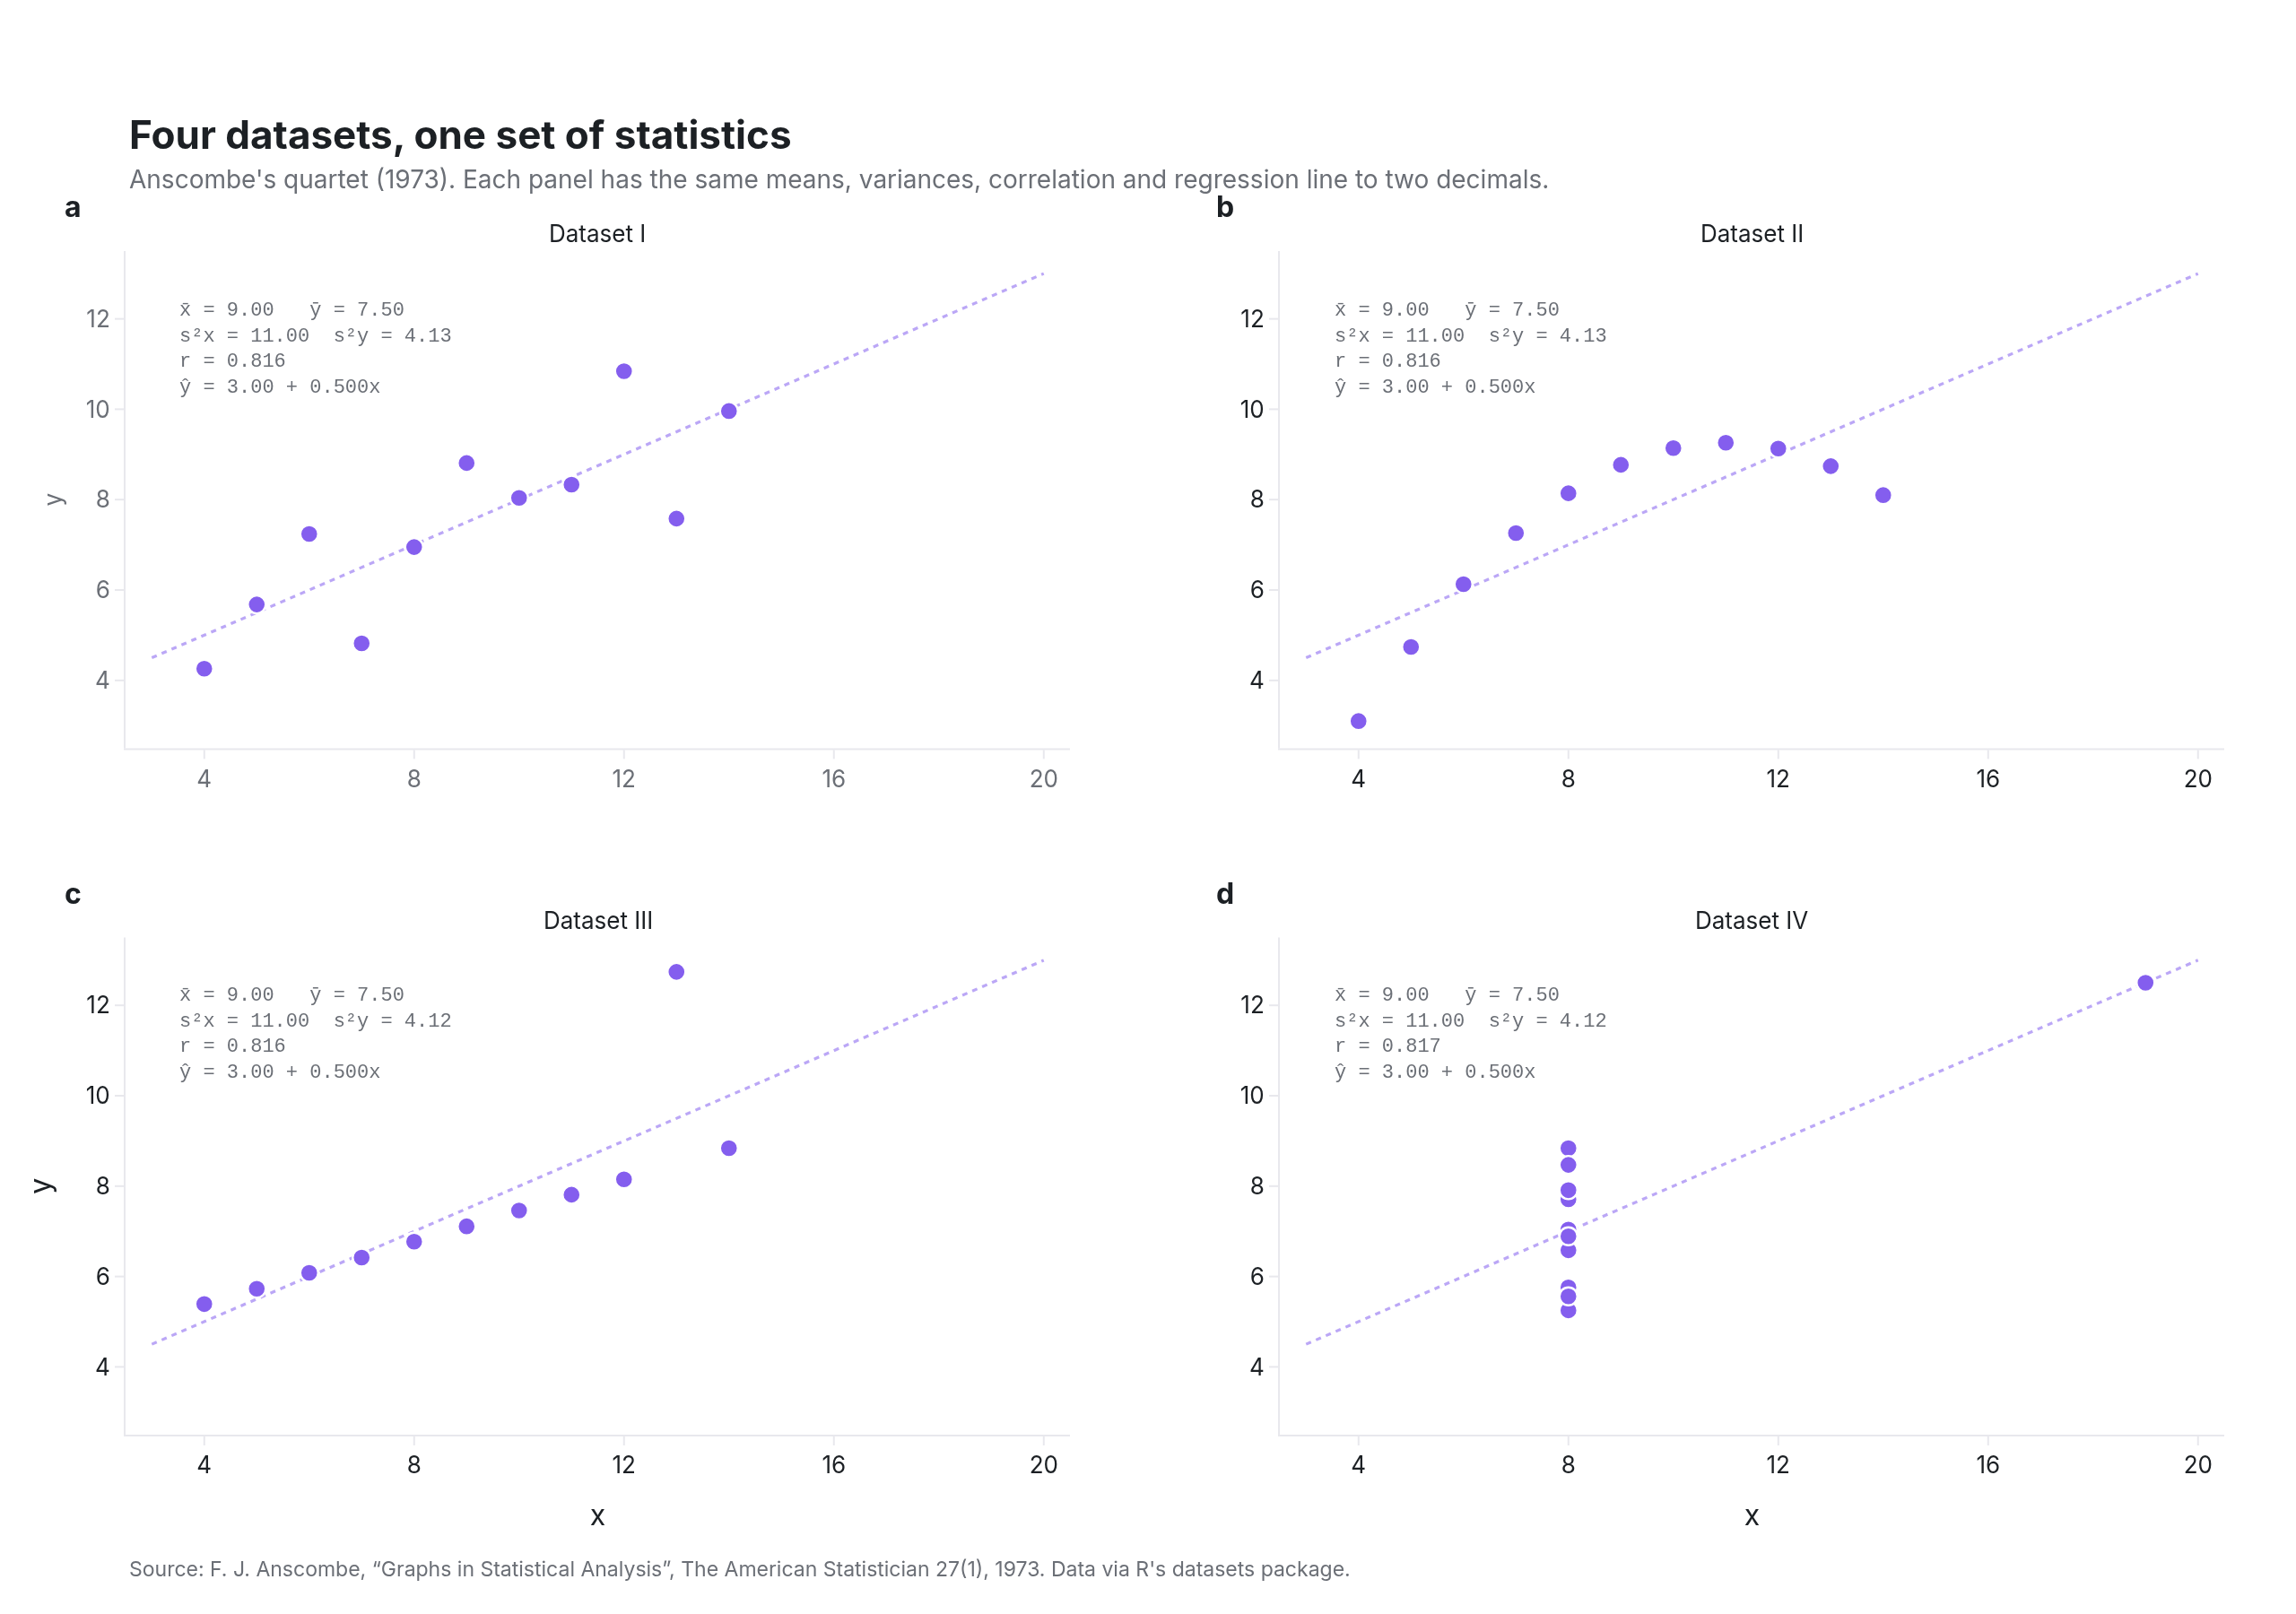
Anscombe's quartet
four datasets with identical summary statistics
Example from Plotly for highly customizable print-ready data visualization · shared helpers
Python Code
"""Anscombe's quartet — four datasets with identical summary statistics.

The matplotlib-gallery staple, set as a journal figure: 2×2 panels with
lettered corners, the OLS fit drawn through each, and the statistics that
fail to tell the four apart typeset in a monospace block in every panel.
"""
from pathlib import Path

from _shared import fetch_csv, save, base_layout, titles, panel_label, INK, MUTED, GRID, VIOLET, MONO, hex_to_rgba

import numpy as np
import plotly.graph_objects as go
from plotly.subplots import make_subplots

CHART_NUM = 7
URL = "https://vincentarelbundock.github.io/Rdatasets/csv/datasets/anscombe.csv"


def generate():
    df = fetch_csv(URL)
    fig = make_subplots(rows=2, cols=2, horizontal_spacing=0.10, vertical_spacing=0.16,
                        subplot_titles=[f"Dataset {k}" for k in "I II III IV".split()])
    xs = np.linspace(3, 20, 2)
    for i in range(4):
        r, c = divmod(i, 2)
        x, y = df[f"x{i + 1}"].to_numpy(float), df[f"y{i + 1}"].to_numpy(float)
        slope, intercept = np.polyfit(x, y, 1)
        rho = np.corrcoef(x, y)[0, 1]
        fig.add_trace(go.Scatter(x=xs, y=slope * xs + intercept, mode="lines",
                                 line=dict(color=hex_to_rgba(VIOLET, 0.55), width=1.6, dash="dot"), hoverinfo="skip"), row=r + 1, col=c + 1)
        fig.add_trace(go.Scatter(x=x, y=y, mode="markers", marker=dict(size=10, color=VIOLET, line=dict(color="white", width=1.2)),
                                 hovertemplate="x=%{x:.1f}, y=%{y:.2f}<extra></extra>"), row=r + 1, col=c + 1)
        stats = (f"x̄ = {x.mean():.2f}   ȳ = {y.mean():.2f}<br>"
                 f"s²x = {x.var(ddof=1):.2f}  s²y = {y.var(ddof=1):.2f}<br>"
                 f"r = {rho:.3f}<br>"
                 f"ŷ = {intercept:.2f} + {slope:.3f}x")
        fig.add_annotation(x=3.4, y=12.6, xref=f"x{i + 1 if i else ''}", yref=f"y{i + 1 if i else ''}",
                           text=stats, showarrow=False, xanchor="left", yanchor="top", align="left",
                           font=dict(family=MONO, size=11, color=MUTED), bgcolor="rgba(255,255,255,0.85)", borderpad=3)
        panel_label(fig, "abcd"[i], x=fig.layout[f"xaxis{i + 1 if i else ''}"].domain[0] - 0.02,
                    y=fig.layout[f"yaxis{i + 1 if i else ''}"].domain[1] + 0.02)

    fig.update_layout(**base_layout(margin=dict(l=70, r=40, t=140, b=100)))
    fig.update_xaxes(range=[2.5, 20.5], dtick=4, showgrid=False, showline=True, linecolor=GRID, ticks="outside", tickcolor=GRID, ticklen=5)
    fig.update_yaxes(range=[2.5, 13.5], dtick=2, showgrid=False, showline=True, linecolor=GRID, ticks="outside", tickcolor=GRID, ticklen=5)
    fig.update_xaxes(title_text="x", row=2)
    fig.update_yaxes(title_text="y", col=1)
    fig.update_annotations(selector=dict(text="Dataset I"), font=dict(size=13, color=INK))
    for a in fig.layout.annotations:
        if a.text and a.text.startswith("Dataset"):
            a.update(font=dict(size=13, color=INK))
    titles(fig, "Four datasets, one set of statistics",
           "Anscombe's quartet (1973). Each panel has the same means, variances, correlation and regression line to two decimals.",
           "Source: F. J. Anscombe, “Graphs in Statistical Analysis”, The American Statistician 27(1), 1973. Data via R's datasets package.", lift=20, source_shift=-66)
    save(CHART_NUM, fig, width=1280, height=900)
Made with Plotly