
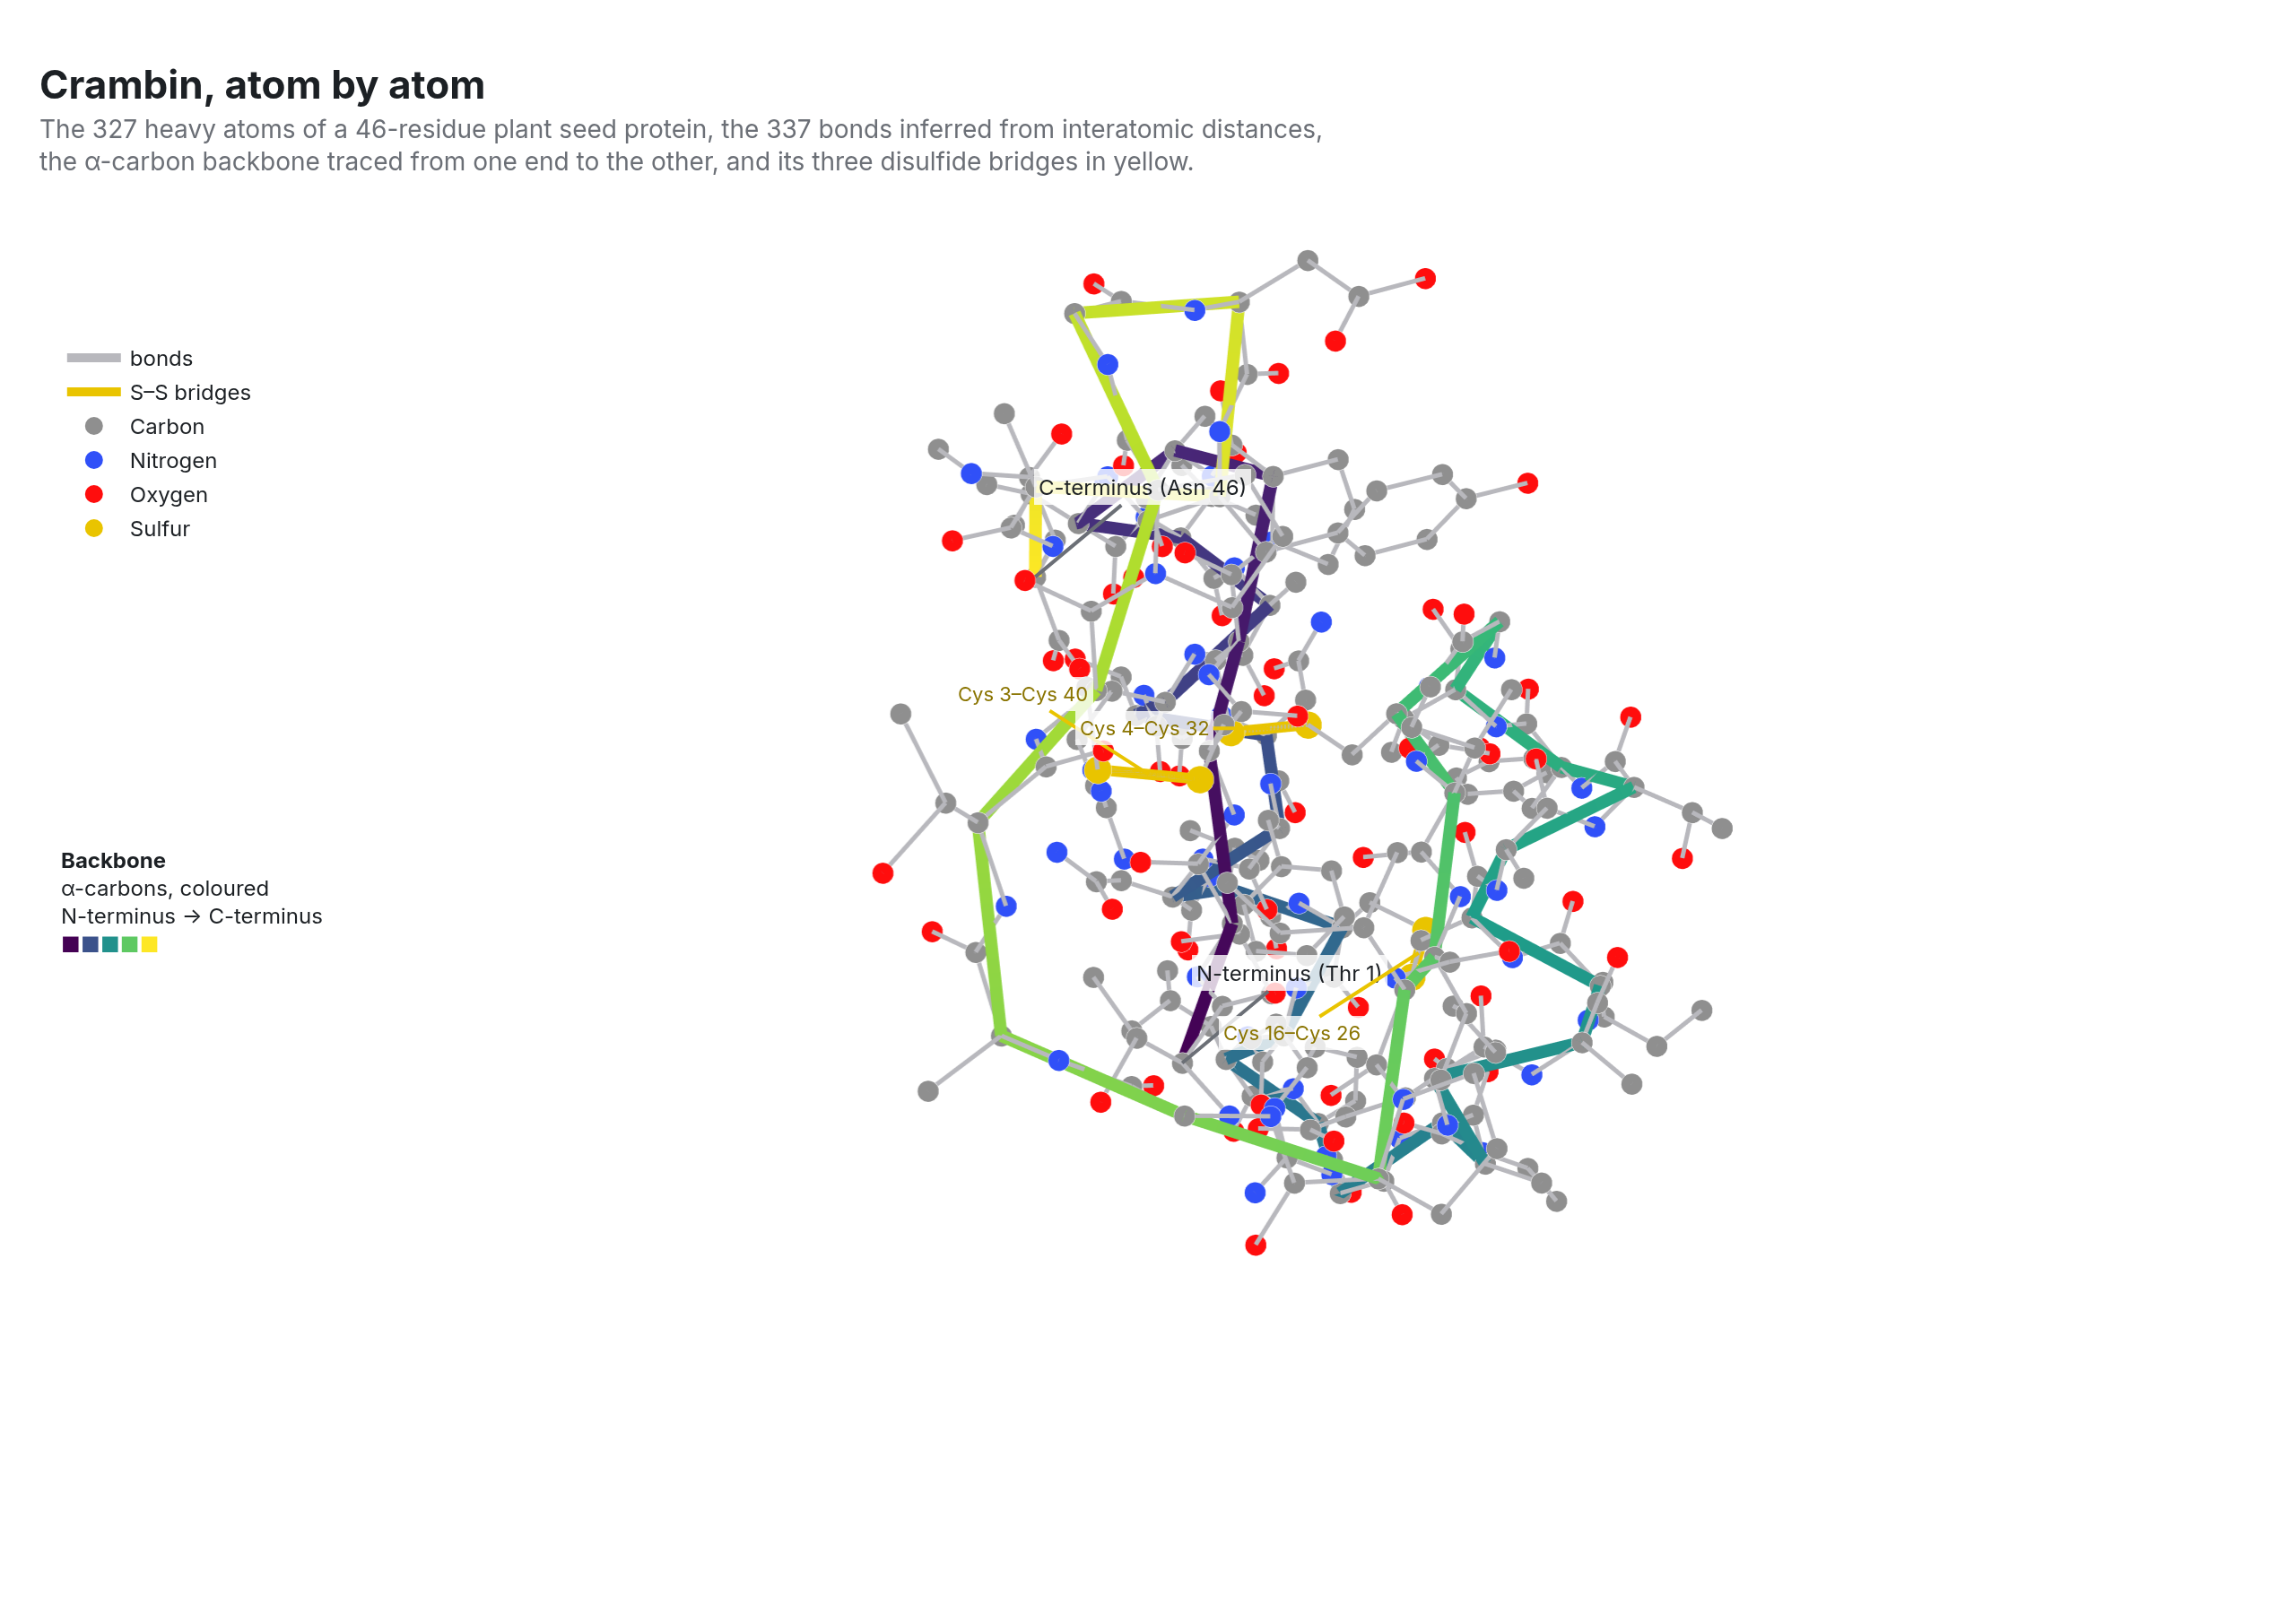
Ball and stick
crambin, all 327 heavy atoms, from its PDB file
Example from Plotly for highly customizable print-ready data visualization · shared helpers
Python Code
"""Ball and stick — crambin, all 327 heavy atoms, from its PDB file.

A molecular viewer built from two scatter3d traces: atoms as spheres in the
CPK colours, bonds inferred by distance and drawn as one None-gapped line
trace, the α-carbon backbone as a thick ribbon-coloured tube through the
middle, and the three disulfide bridges picked out. No axes at all.
"""
from pathlib import Path

from _shared import fetch_text, save, base_layout, titles, INK, MUTED

import numpy as np
import plotly.colors as pc
import plotly.graph_objects as go

CHART_NUM = 26
URL = "https://files.rcsb.org/download/1CRN.pdb"
CPK = {"C": "#8f8f8f", "N": "#3050f8", "O": "#ff0d0d", "S": "#e9c400"}
RADIUS = {"C": 7, "N": 7, "O": 7, "S": 9}
BOND_MAX = {"SS": 2.15, "default": 1.95}   # Å


def generate():
    atoms = []
    for line in fetch_text(URL).splitlines():
        if line.startswith("ATOM"):
            atoms.append(dict(name=line[12:16].strip(), res=line[17:20], resi=int(line[22:26]),
                              x=float(line[30:38]), y=float(line[38:46]), z=float(line[46:54]), el=line[76:78].strip() or line[12:14].strip()[0]))
    xyz = np.array([[a["x"], a["y"], a["z"]] for a in atoms])
    xyz -= xyz.mean(axis=0)
    el = np.array([a["el"] for a in atoms])

    # Bonds: every pair closer than a covalent-bond length.
    d = np.linalg.norm(xyz[:, None] - xyz[None], axis=-1)
    bx, by, bz, ss = [], [], [], []
    for i in range(len(atoms)):
        for j in range(i + 1, len(atoms)):
            cut = BOND_MAX["SS"] if el[i] == el[j] == "S" else BOND_MAX["default"]
            if d[i, j] < cut:
                seg = (bx, by, bz)
                if el[i] == el[j] == "S":
                    ss.append((i, j))
                for arr, k in zip(seg, range(3)):
                    arr += [xyz[i, k], xyz[j, k], None]

    fig = go.Figure()
    fig.add_trace(go.Scatter3d(x=bx, y=by, z=bz, mode="lines", line=dict(color="#b8b8bd", width=5), hoverinfo="skip", name="bonds"))
    sx, sy, sz = [], [], []
    for i, j in ss:
        sx += [xyz[i, 0], xyz[j, 0], None]; sy += [xyz[i, 1], xyz[j, 1], None]; sz += [xyz[i, 2], xyz[j, 2], None]
    fig.add_trace(go.Scatter3d(x=sx, y=sy, z=sz, mode="lines", line=dict(color=CPK["S"], width=12), hoverinfo="skip", name="S–S bridges"))
    # Backbone through the α-carbons, coloured from the N- to the C-terminus.
    ca = [a for a in atoms if a["name"] == "CA"]
    ca_xyz = np.array([[a["x"], a["y"], a["z"]] for a in ca]) - np.array([[a["x"], a["y"], a["z"]] for a in atoms]).mean(axis=0)
    fig.add_trace(go.Scatter3d(x=ca_xyz[:, 0], y=ca_xyz[:, 1], z=ca_xyz[:, 2], mode="lines",
                               line=dict(color=[a["resi"] for a in ca], colorscale="Viridis", width=14), showlegend=False,
                               hovertemplate="%{text}<extra>backbone</extra>", text=[f"{a['res']} {a['resi']}" for a in ca], name="backbone"))
    for e in ("C", "N", "O", "S"):
        m = el == e
        fig.add_trace(go.Scatter3d(x=xyz[m, 0], y=xyz[m, 1], z=xyz[m, 2], mode="markers",
                                   marker=dict(size=RADIUS[e], color=CPK[e], line=dict(color="white", width=0.5)),
                                   text=[f"{a['name']} · {a['res']} {a['resi']}" for a, keep in zip(atoms, m) if keep],
                                   hovertemplate="%{text}<extra>" + e + "</extra>", name={"C": "Carbon", "N": "Nitrogen", "O": "Oxygen", "S": "Sulfur"}[e]))

    labels = [(ca_xyz[0], "N-terminus (Thr 1)"), (ca_xyz[-1], "C-terminus (Asn 46)")]
    fig.update_layout(**base_layout(margin=dict(l=20, r=20, t=110, b=40), showlegend=True,
                                    legend=dict(x=0.01, y=0.9, xanchor="left", yanchor="top", font=dict(size=12), itemsizing="constant", bgcolor="rgba(0,0,0,0)")))
    fig.add_annotation(x=0.01, y=0.52, xref="paper", yref="paper", xanchor="left", yanchor="top", showarrow=False, align="left",
                       text="<b>Backbone</b><br>α-carbons, coloured<br>N-terminus → C-terminus<br>"
                            "<span style='color:#440154'>■</span><span style='color:#3b528b'>■</span><span style='color:#21918c'>■</span>"
                            "<span style='color:#5ec962'>■</span><span style='color:#fde725'>■</span>", font=dict(size=12, color=INK))
    fig.update_layout(scene=dict(
        xaxis=dict(visible=False), yaxis=dict(visible=False), zaxis=dict(visible=False), aspectmode="data",
        camera=dict(eye=dict(x=1.05, y=0.85, z=0.5)), bgcolor="white", domain=dict(x=[0.12, 1], y=[0, 1.0]),
        annotations=[dict(x=p[0], y=p[1], z=p[2], text=t, showarrow=True, arrowhead=0, arrowcolor=MUTED, ax=60, ay=-50,
                          font=dict(size=12, color=INK), bgcolor="rgba(255,255,255,0.8)", borderpad=2) for p, t in labels]
                    + [dict(x=(xyz[i, 0] + xyz[j, 0]) / 2, y=(xyz[i, 1] + xyz[j, 1]) / 2, z=(xyz[i, 2] + xyz[j, 2]) / 2,
                            text=f"Cys {atoms[i]['resi']}–Cys {atoms[j]['resi']}", showarrow=True, arrowhead=0, arrowcolor=CPK["S"],
                            ax=-70, ay=45 * (k - 1), font=dict(size=11, color="#8a7400"), bgcolor="rgba(255,255,255,0.8)", borderpad=2)
                       for k, (i, j) in enumerate(ss)],
    ))
    titles(fig, "Crambin, atom by atom",
           f"The {len(atoms)} heavy atoms of a 46-residue plant seed protein, the {len(bx) // 3} bonds inferred from interatomic distances,<br>"
           "the α-carbon backbone traced from one end to the other, and its three disulfide bridges in yellow.",
           "Source: Protein Data Bank entry 1CRN (Teeter 1981, 0.945 Å X-ray structure), atomic coordinates read straight from the PDB file.")
    save(CHART_NUM, fig, width=1280, height=900)
Made with Plotly