
Beeswarm
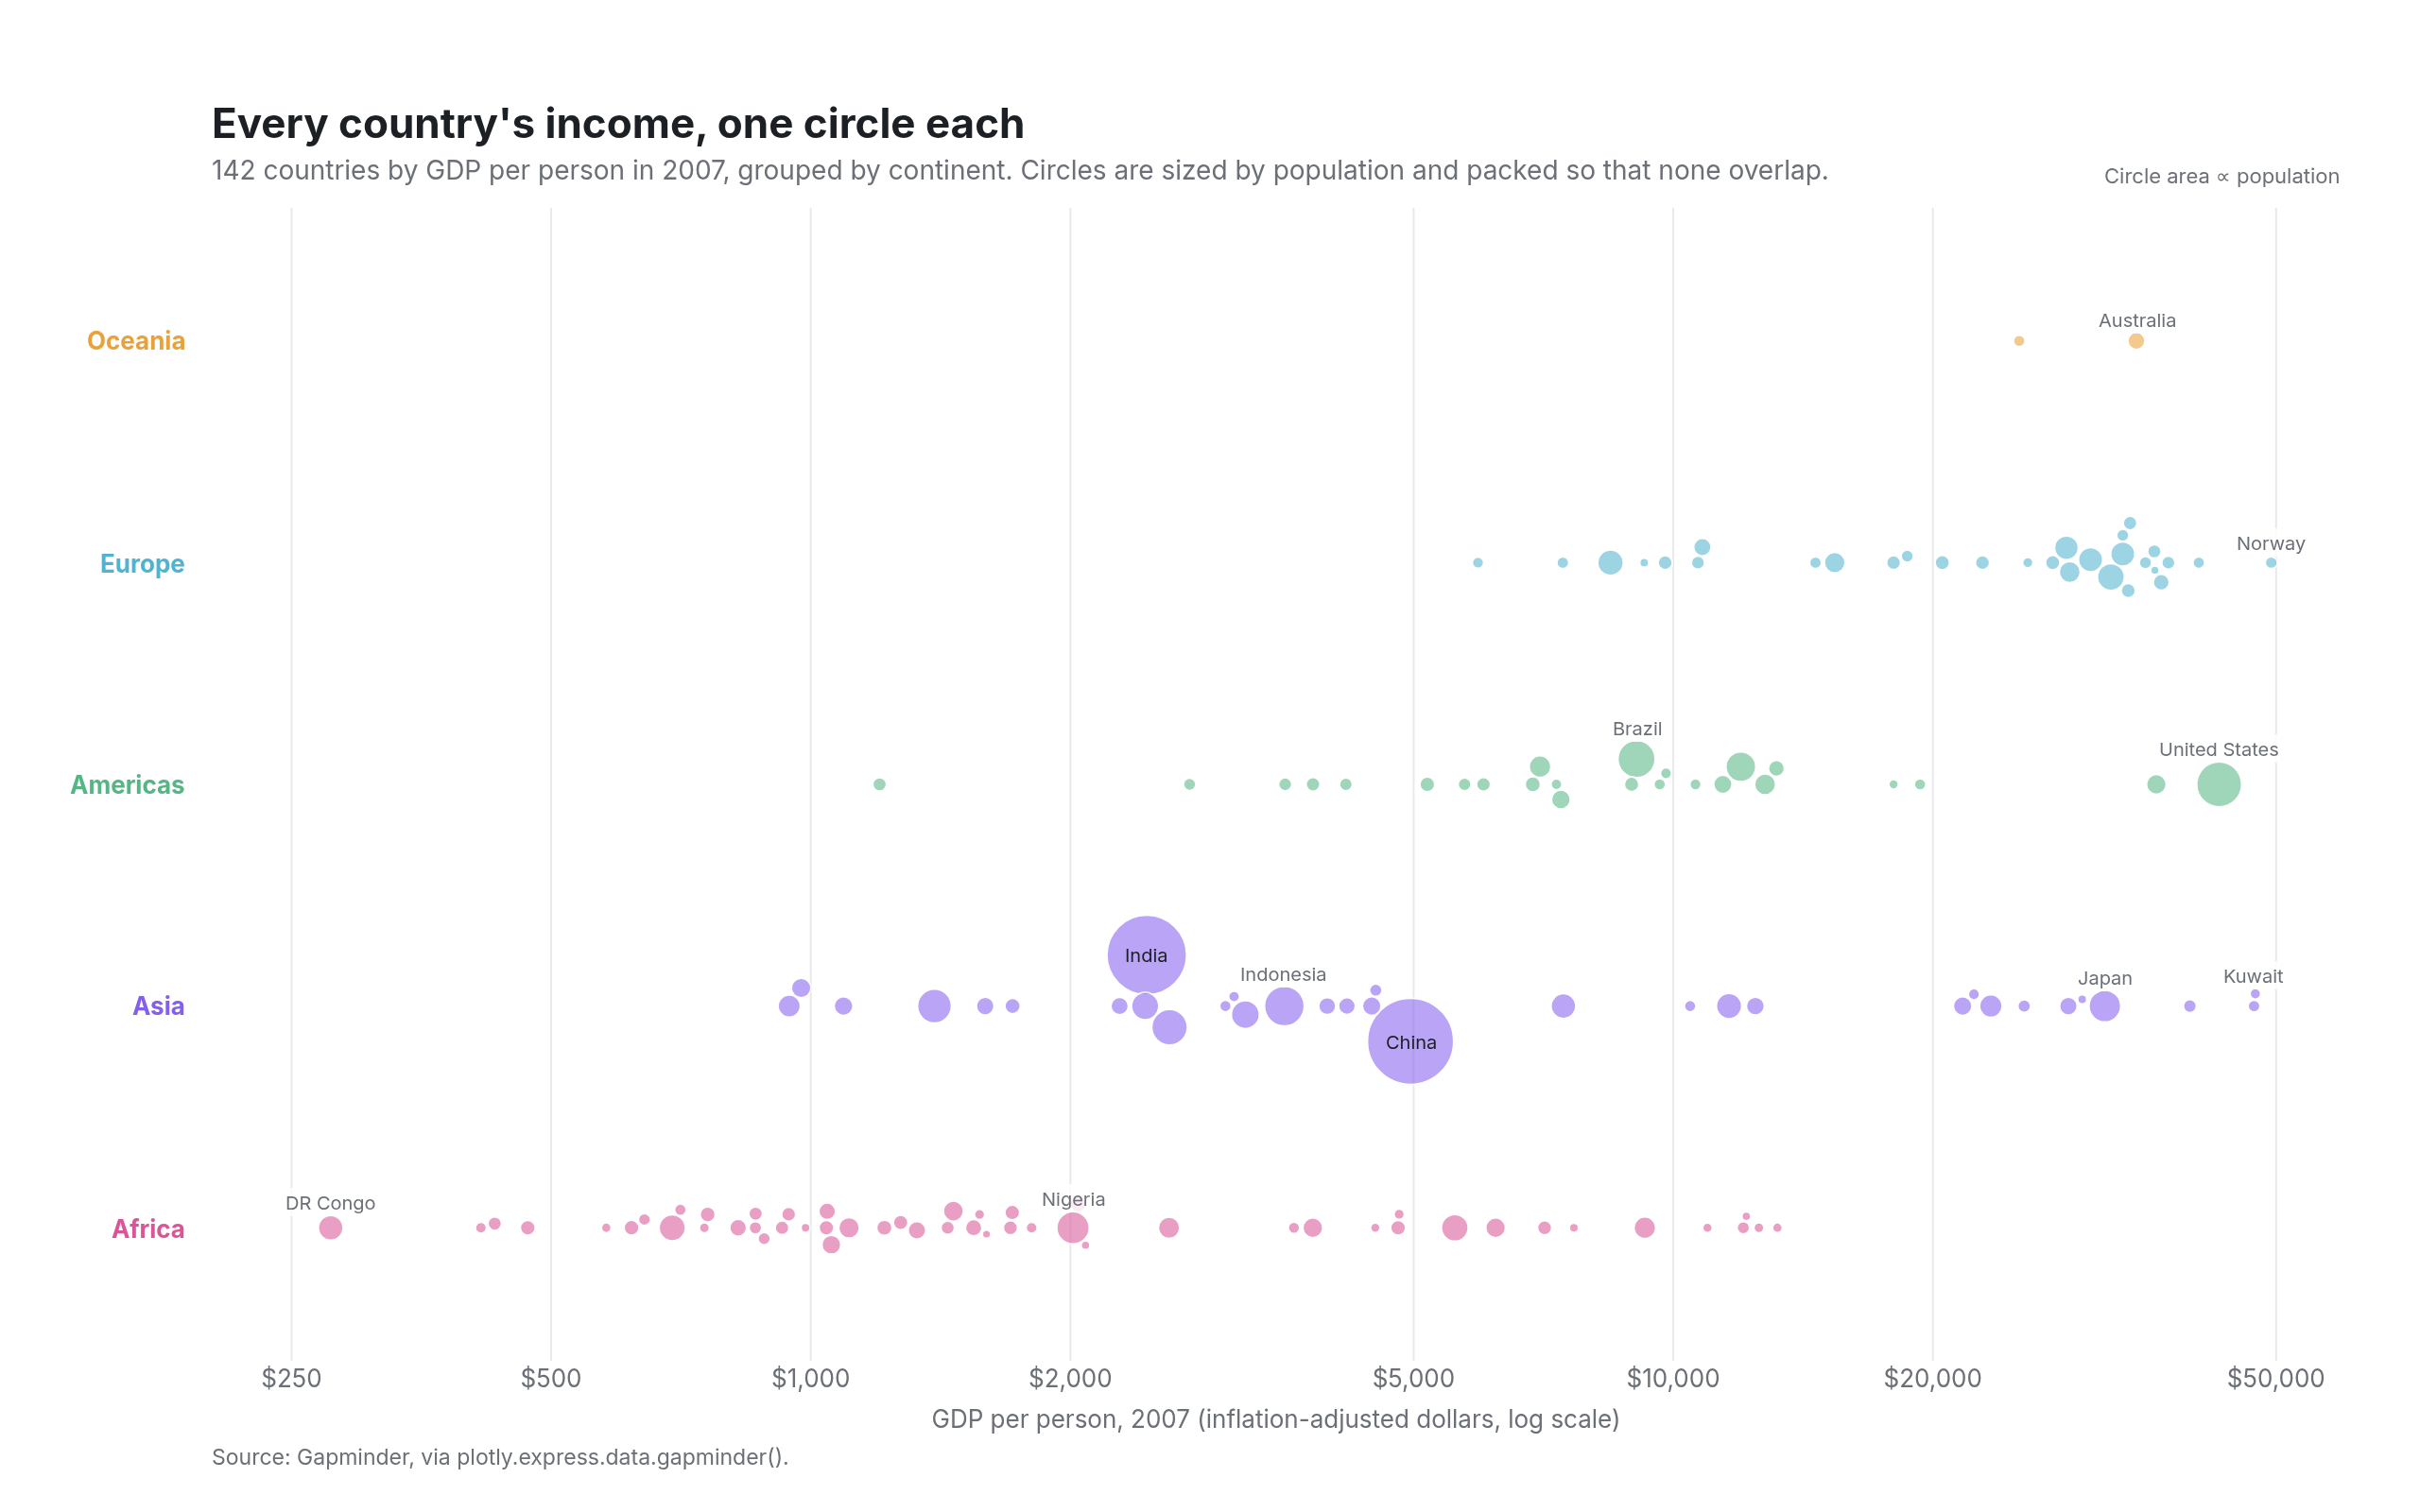
GDP per person in 142 countries, one circle each, sized by population
Example from Plotly for highly customizable print-ready data visualization · shared helpers
Python Code
"""Beeswarm — GDP per person in 142 countries, one circle each, sized by population.

Points packed by hand so none overlap: sorted along the axis, then each
dropped into the nearest free slot above or below the centre line. Bubbles
are sized by population, so the swarm packs unevenly, the way a newspaper
graphic of this kind does.
"""
from pathlib import Path

from _shared import save, base_layout, titles, INK, MUTED, FAINT, GRID, VIOLET, TEAL, GREEN, PINK, ORANGE, hex_to_rgba

import numpy as np
import plotly.express as px
import plotly.graph_objects as go

CHART_NUM = 23
COLORS = {"Asia": VIOLET, "Europe": TEAL, "Americas": GREEN, "Africa": PINK, "Oceania": ORANGE}
ORDER = ["Africa", "Asia", "Americas", "Europe", "Oceania"]
PLOT_W, PLOT_H = 1130, 640      # pixel size of the plot area, for the packing
XR = (np.log10(200), np.log10(60000))
LABEL = ["China", "India", "United States", "Nigeria", "Norway", "Japan", "Brazil", "Congo, Dem. Rep.", "Kuwait", "Australia", "Indonesia"]


def swarm(x_px, r_px):
    """Greedy beeswarm: place each point at the smallest |y| that avoids every placed circle."""
    order = np.argsort(x_px)
    y = np.zeros(len(x_px))
    placed = []
    for i in order:
        cands = [0.0]
        for j in placed:
            dx = abs(x_px[i] - x_px[j])
            rr = r_px[i] + r_px[j] + 1.0
            if dx < rr:
                dy = np.sqrt(rr ** 2 - dx ** 2)
                cands += [y[j] + dy, y[j] - dy]
        cands.sort(key=abs)
        for c in cands:
            ok = all(np.hypot(x_px[i] - x_px[j], c - y[j]) >= r_px[i] + r_px[j] + 0.9 for j in placed)
            if ok:
                y[i] = c
                break
        placed.append(i)
    return y


def generate():
    df = px.data.gapminder().query("year == 2007").reset_index(drop=True)
    size = 4 + np.sqrt(df["pop"] / 1e6) * 1.15          # marker diameter in px
    x_px = (np.log10(df["gdpPercap"]) - XR[0]) / (XR[1] - XR[0]) * PLOT_W
    row_h = PLOT_H / len(ORDER)
    fig = go.Figure()
    for k, cont in enumerate(ORDER):
        idx = df.index[df["continent"] == cont].to_numpy()
        y_px = swarm(x_px[idx].to_numpy(), (size[idx] / 2).to_numpy())
        y = k + y_px / row_h
        sub = df.loc[idx]
        fig.add_trace(go.Scatter(
            x=sub["gdpPercap"], y=y, mode="markers", name=cont,
            marker=dict(size=size[idx], color=hex_to_rgba(COLORS[cont], 0.8), line=dict(color="white", width=1)),
            text=sub["country"], customdata=np.c_[sub["pop"] / 1e6, sub["lifeExp"]],
            hovertemplate="<b>%{text}</b><br>$%{x:,.0f} per person<br>%{customdata[0]:.0f}M people<extra></extra>",
        ))
        for c, yy, gdp, s in zip(sub["country"], y, sub["gdpPercap"], size[idx]):
            if c in LABEL:
                fig.add_annotation(x=np.log10(gdp), y=yy, text=c.replace("Congo, Dem. Rep.", "DR Congo"), showarrow=False,
                                   font=dict(size=10, color=INK if s > 26 else MUTED), yshift=0 if s > 26 else s / 2 + 7,
                                   bgcolor="rgba(0,0,0,0)" if s > 26 else "rgba(255,255,255,0.8)", borderpad=1)
        fig.add_annotation(x=0, y=k, xref="paper", text=f"<b>{cont}</b>", showarrow=False, xanchor="right", xshift=-10, font=dict(size=13, color=COLORS[cont]))
        fig.add_shape(type="line", x0=XR[0], x1=XR[1], y0=k, y1=k, line=dict(color=GRID, width=1), layer="below")
    fig.update_layout(**base_layout(margin=dict(l=110, r=40, t=110, b=80)))
    fig.update_xaxes(type="log", range=list(XR), tickvals=[250, 500, 1000, 2000, 5000, 10000, 20000, 50000],
                     ticktext=["$250", "$500", "$1,000", "$2,000", "$5,000", "$10,000", "$20,000", "$50,000"],
                     title_text="GDP per person, 2007 (inflation-adjusted dollars, log scale)", showgrid=True)
    fig.update_yaxes(visible=False, range=[-0.6, len(ORDER) - 0.4])
    fig.add_annotation(x=1, y=1, xref="paper", yref="paper", xanchor="right", yanchor="bottom", yshift=8, showarrow=False,
                       text="Circle area ∝ population", font=dict(size=11, color=MUTED))
    titles(fig, "Every country's income, one circle each",
           "142 countries by GDP per person in 2007, grouped by continent. Circles are sized by population and packed so that none overlap.",
           "Source: Gapminder, via plotly.express.data.gapminder().")
    save(CHART_NUM, fig)
Made with Plotly