
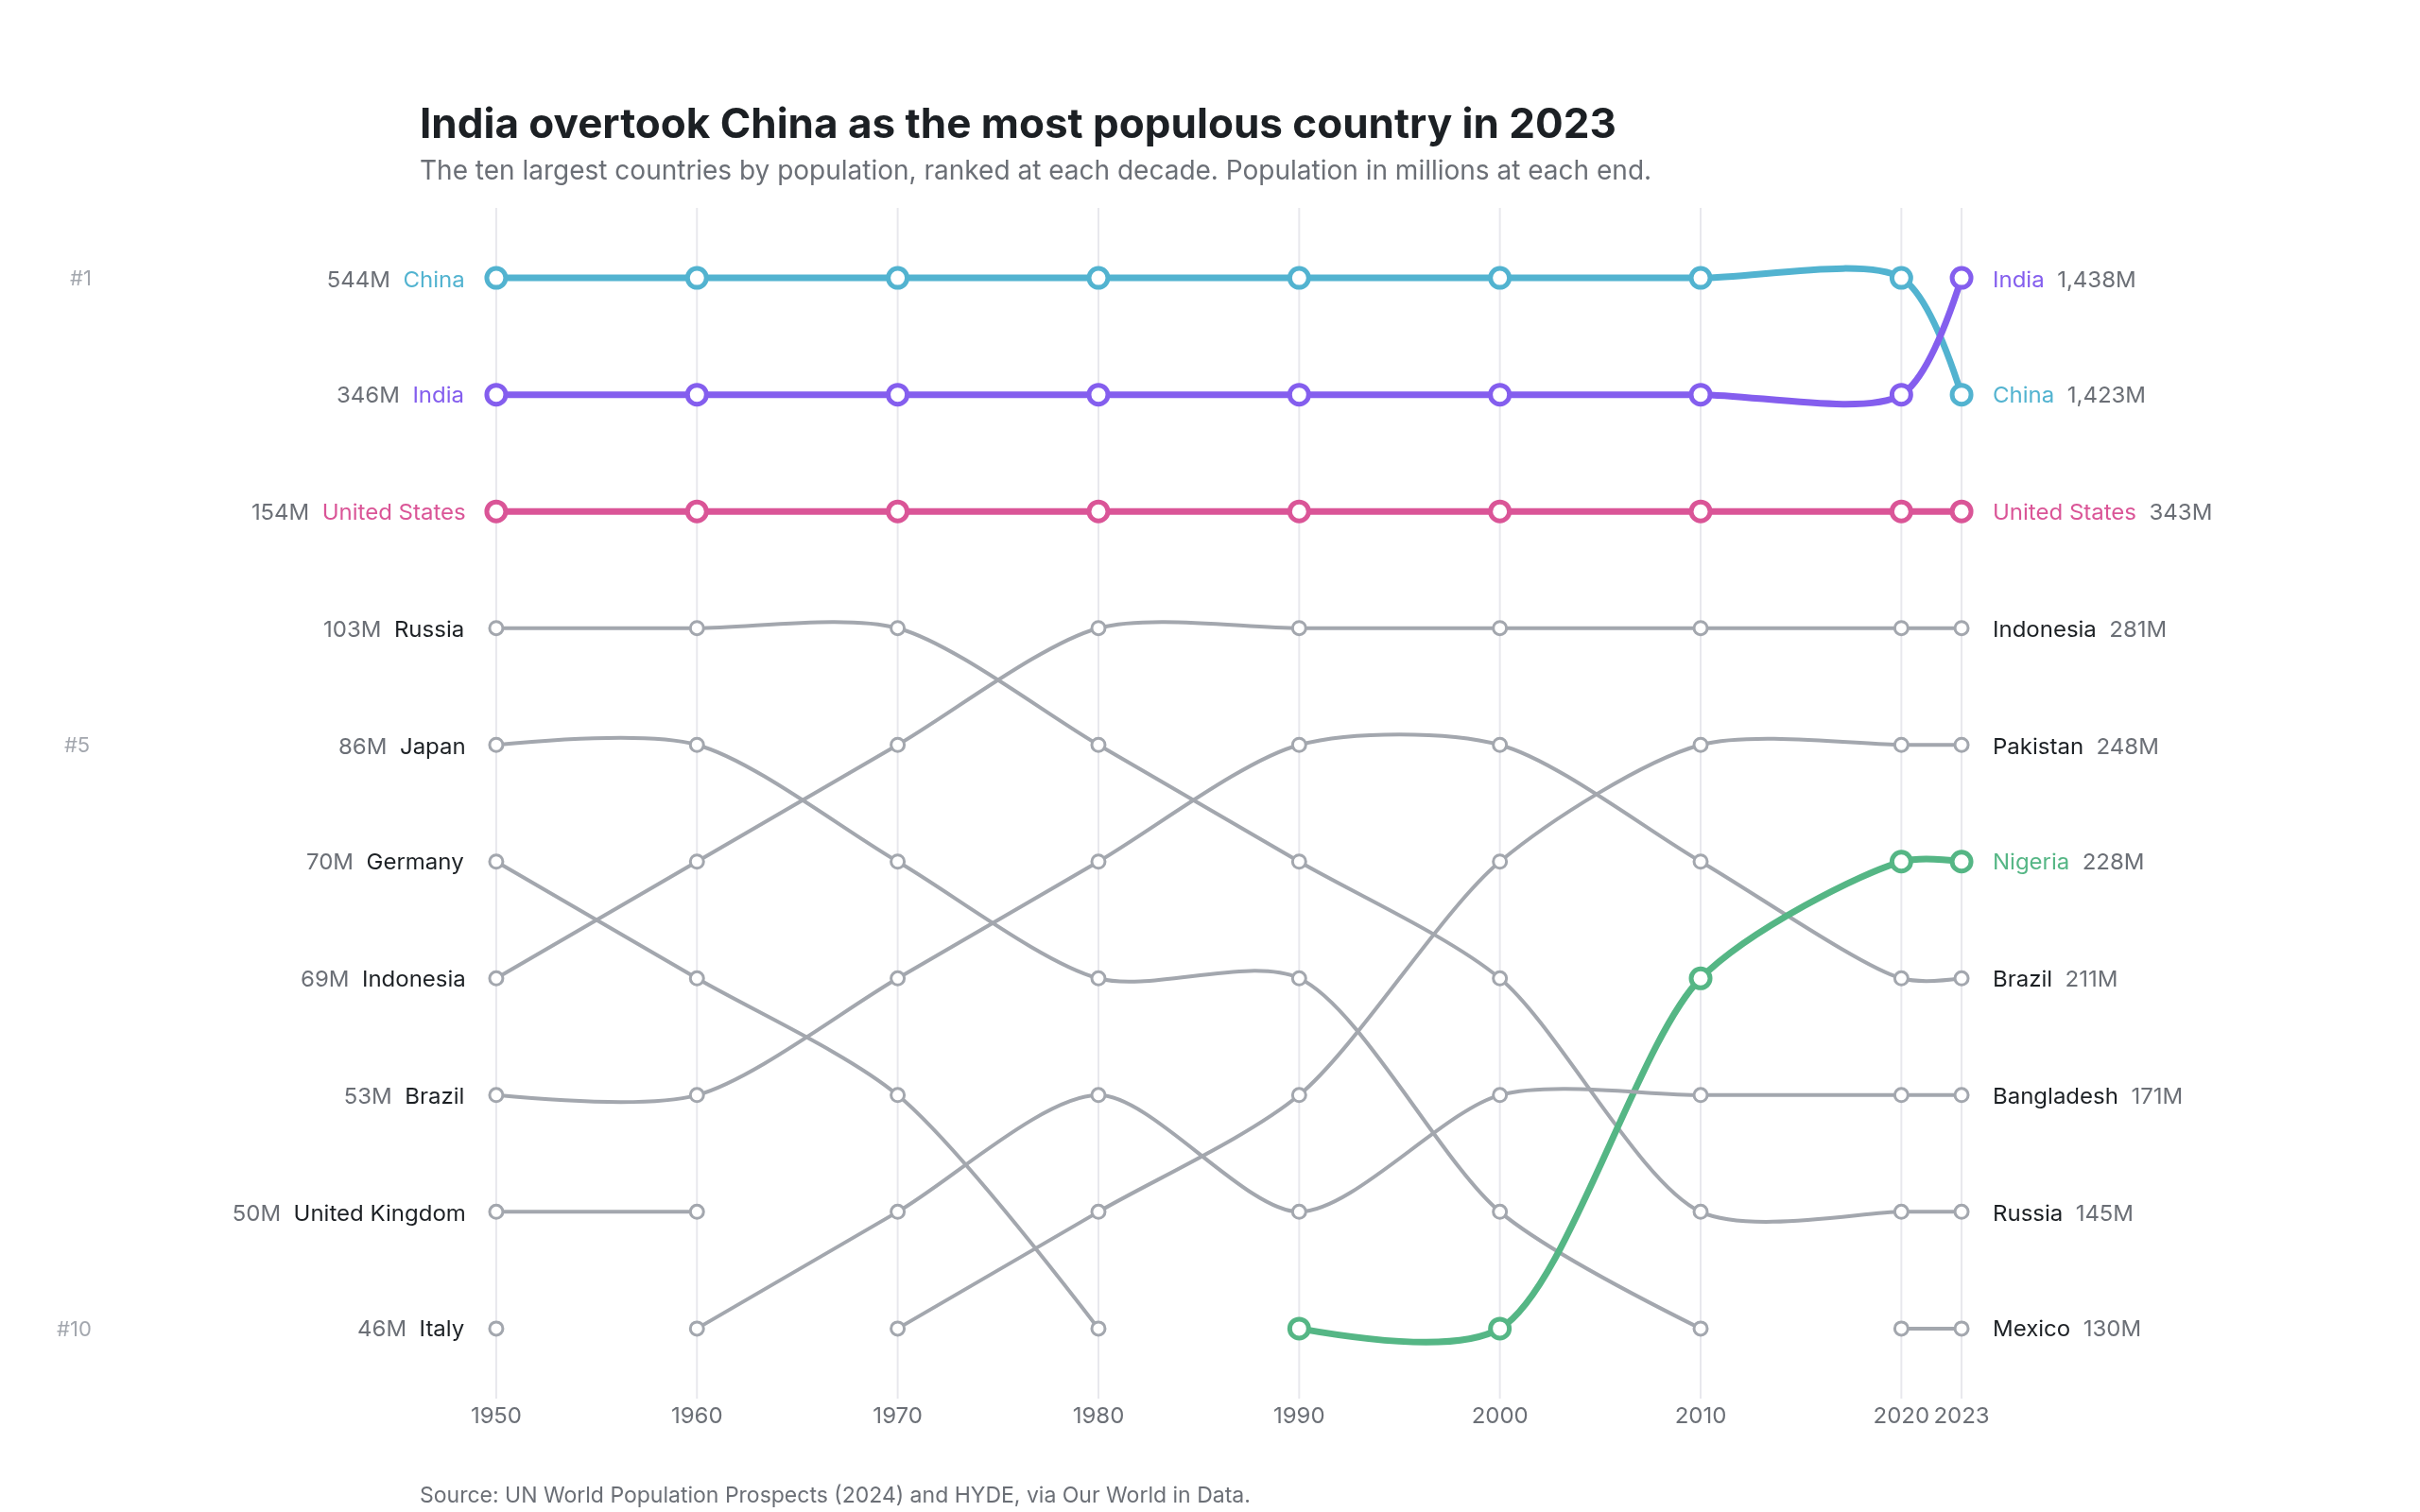
Bump chart
the ten most populous countries, ranked every decade since 1950
Example from Plotly for highly customizable print-ready data visualization · shared helpers
Python Code
"""Bump chart — the ten most populous countries, ranked every decade since 1950.

Rank on the y axis, time on the x, and a smoothed line per country so the
overtakes read as crossings. Names at both ends, the two countries that
swapped first place in colour, everything else in grey.
"""
from pathlib import Path

from _shared import fetch_csv, save, base_layout, titles, INK, MUTED, FAINT, GRID, VIOLET, TEAL, PINK, GREEN, hex_to_rgba

import numpy as np
import plotly.graph_objects as go

CHART_NUM = 18
URL = "https://ourworldindata.org/grapher/population.csv?csvType=full&useColumnShortNames=true"
YEARS = [1950, 1960, 1970, 1980, 1990, 2000, 2010, 2020, 2023]
TOP = 10
HIGHLIGHT = {"India": VIOLET, "China": TEAL, "Nigeria": GREEN, "United States": PINK}


def generate():
    df = fetch_csv(URL)
    df = df[df["code"].notna() & (df["code"].str.len() == 3) & (df["code"] != "OWID_WRL") & df["year"].isin(YEARS)]
    df["rank"] = df.groupby("year")["population_historical"].rank(ascending=False, method="first")
    df = df[df["rank"] <= TOP]
    countries = sorted(df["entity"].unique(), key=lambda c: df[df["entity"] == c]["rank"].min())

    fig = go.Figure()
    for c in countries:
        g = df[df["entity"] == c].sort_values("year")
        color = HIGHLIGHT.get(c, FAINT)
        hot = c in HIGHLIGHT
        # Break the line where a country drops out of the top ten.
        xs, ys = [], []
        for yr in YEARS:
            row = g[g["year"] == yr]
            xs.append(yr); ys.append(row["rank"].iloc[0] if len(row) else None)
        fig.add_trace(go.Scatter(x=xs, y=ys, mode="lines+markers", name=c, connectgaps=False,
                                 line=dict(color=color, width=3.5 if hot else 2, shape="spline", smoothing=0.8),
                                 marker=dict(size=10 if hot else 7, color="white", line=dict(color=color, width=2.5 if hot else 1.5)),
                                 hovertemplate=f"{c}<br>%{{x}}: #%{{y}}<extra></extra>"))
        for side, yr, anchor, shift in [("first", YEARS[0], "right", -14), ("last", YEARS[-1], "left", 14)]:
            row = g[g["year"] == yr]
            if len(row):
                pop = row["population_historical"].iloc[0] / 1e6
                fig.add_annotation(x=yr, y=row["rank"].iloc[0], text=f"{c}  <span style='color:{MUTED}'>{pop:,.0f}M</span>" if side == "last" else f"<span style='color:{MUTED}'>{pop:,.0f}M</span>  {c}",
                                   showarrow=False, xanchor=anchor, xshift=shift, font=dict(size=12, color=color if hot else INK))
    fig.update_layout(**base_layout(margin=dict(l=220, r=200, t=110, b=60)))
    fig.update_xaxes(tickvals=YEARS, showgrid=True, gridcolor=GRID, range=[1946, 2027], tickfont=dict(size=12))
    fig.update_yaxes(showticklabels=False, showgrid=False, range=[TOP + 0.6, 0.4])
    for i in (1, 5, 10):
        fig.add_annotation(x=0, y=i, xref="paper", text=f"#{i}", showarrow=False, xanchor="right", xshift=-170, font=dict(size=11, color=FAINT))
    titles(fig, "India overtook China as the most populous country in 2023",
           "The ten largest countries by population, ranked at each decade. Population in millions at each end.",
           "Source: UN World Population Prospects (2024) and HYDE, via Our World in Data.")
    save(CHART_NUM, fig)
Made with Plotly