
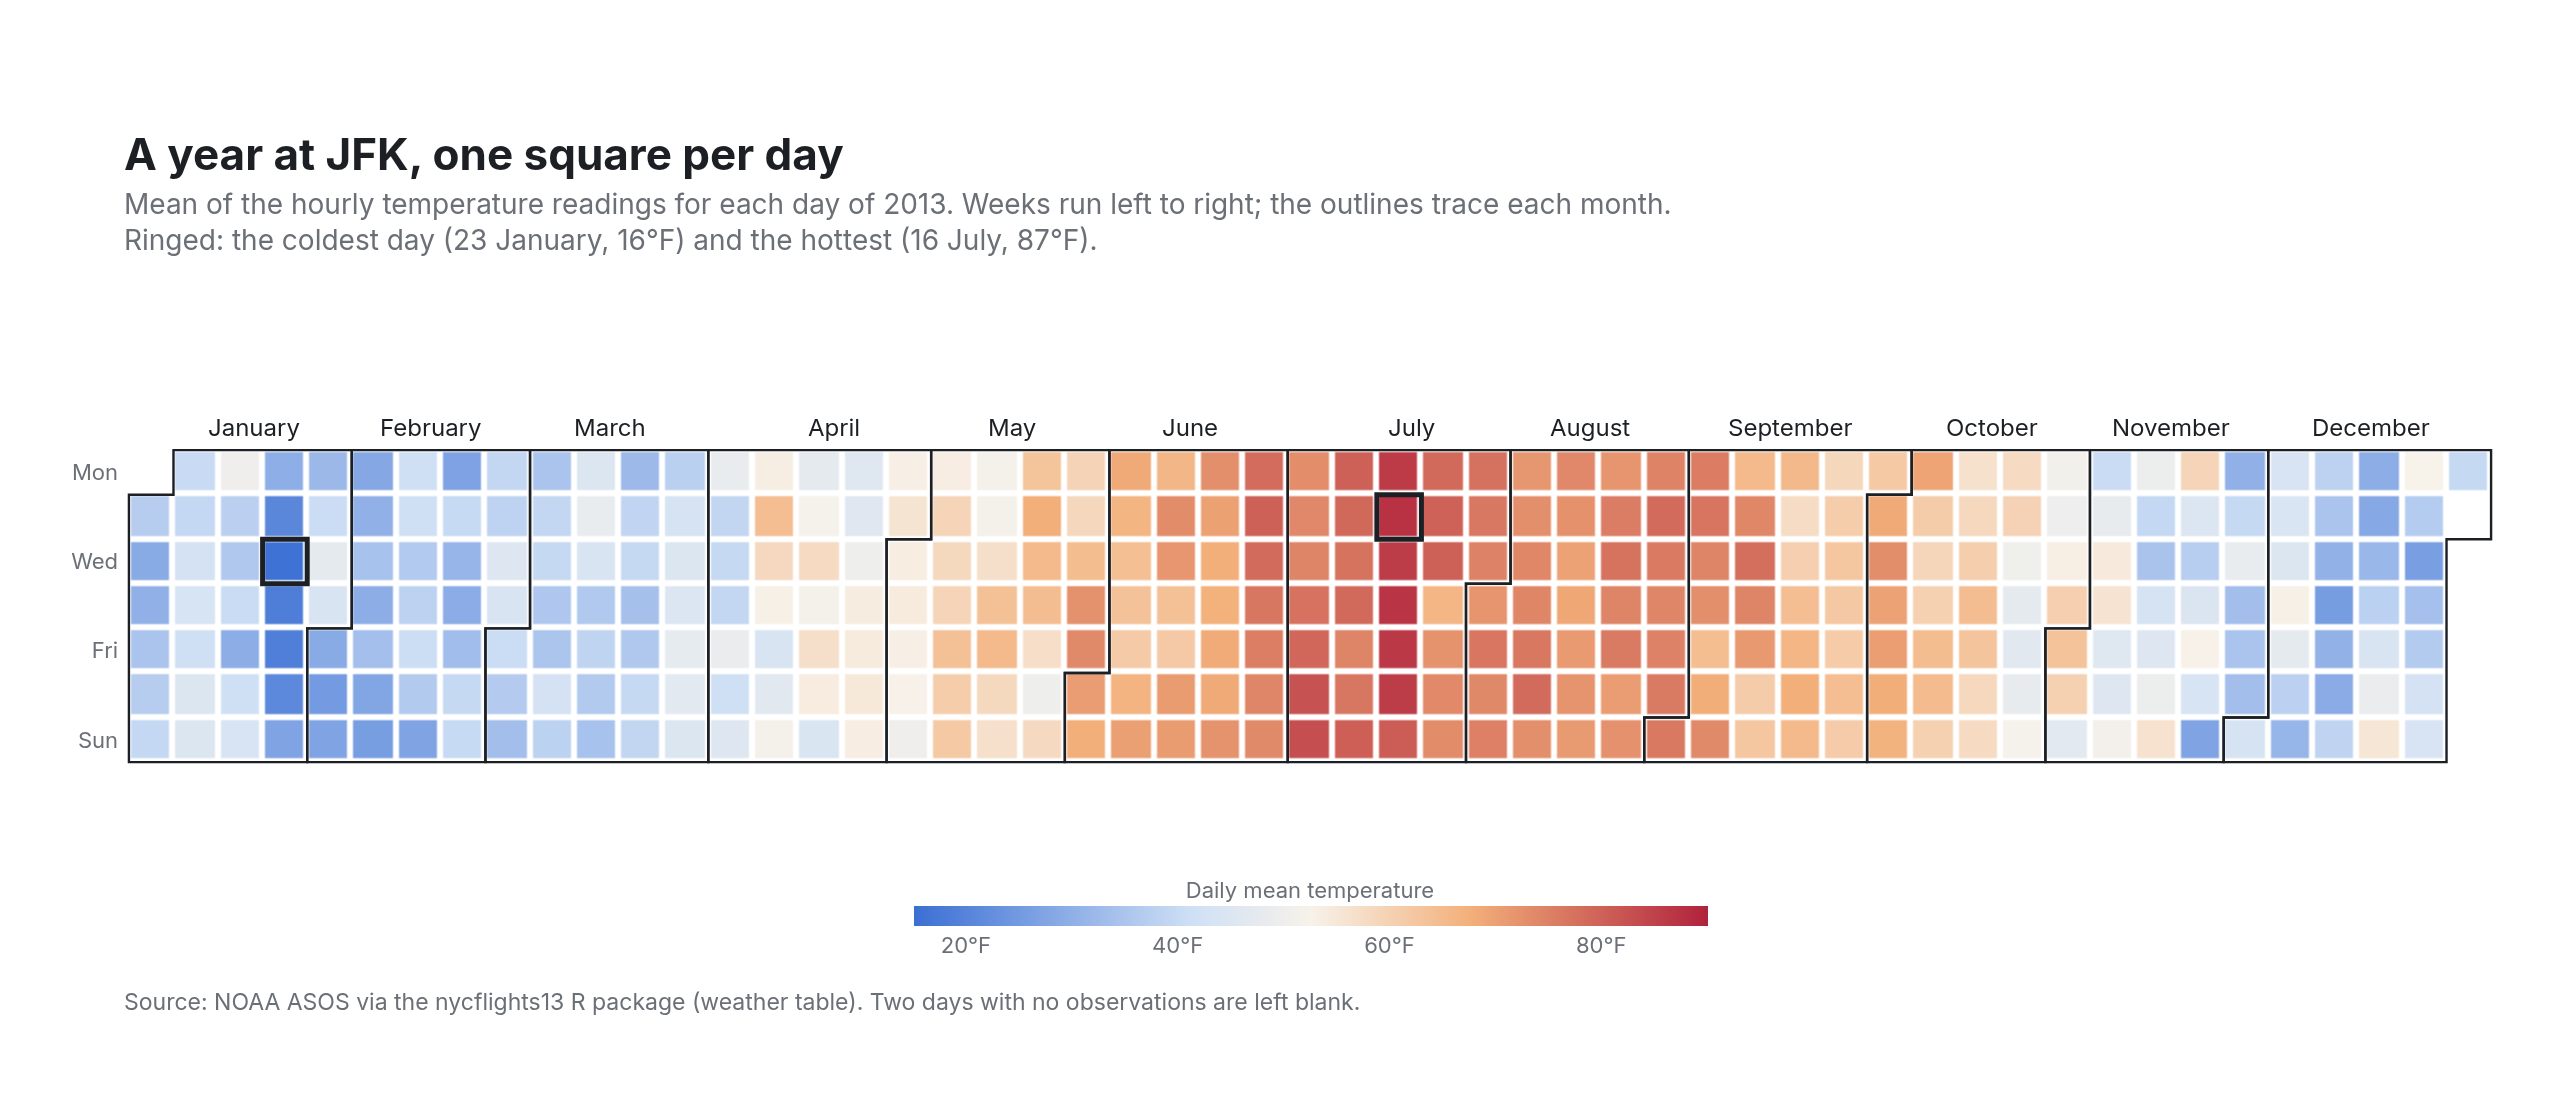
Calendar heatmap
every day of 2013 at JFK, coloured by its mean temperature
Example from Plotly for highly customizable print-ready data visualization · shared helpers
Python Code
"""Calendar heatmap — every day of 2013 at JFK, coloured by its mean temperature.

The GitHub-contributions layout: weeks across, weekdays down, one square
per day, with month boundaries traced as a stepped outline and the month
names set above the first week they contain. A heatmap trace with its
gaps turned into the grid, plus a handful of shapes.
"""
from pathlib import Path

from _shared import fetch_csv, save, base_layout, titles, INK, MUTED, FAINT

import numpy as np
import pandas as pd
import plotly.graph_objects as go

CHART_NUM = 22
URL = "https://vincentarelbundock.github.io/Rdatasets/csv/nycflights13/weather.csv"
SCALE = [[0, "#3b6fd4"], [0.35, "#cfe0f5"], [0.5, "#f7f2ea"], [0.7, "#f3b07a"], [1, "#b0223c"]]


def generate():
    df = fetch_csv(URL, usecols=["origin", "year", "month", "day", "temp"]).dropna()
    df = df[(df["origin"] == "JFK")]
    daily = df.groupby(["year", "month", "day"])["temp"].mean().reset_index()
    daily["date"] = pd.to_datetime(daily[["year", "month", "day"]])
    daily = daily.set_index("date").reindex(pd.date_range("2013-01-01", "2013-12-31"))
    d = daily.index
    week = ((d - pd.Timestamp("2013-01-01")).days + pd.Timestamp("2013-01-01").weekday()) // 7
    wday = d.weekday
    z = np.full((7, week.max() + 1), np.nan)
    z[wday, week] = daily["temp"].to_numpy()

    fig = go.Figure(go.Heatmap(
        z=z, x=np.arange(week.max() + 1), y=np.arange(7), colorscale=SCALE, zmid=55, zmin=15, zmax=90,
        xgap=3, ygap=3, showscale=True,
        colorbar=dict(orientation="h", x=0.5, y=-0.12, len=0.35, thickness=10, ticksuffix="°F", tickfont=dict(size=11, color=MUTED),
                      outlinewidth=0, title=dict(text="Daily mean temperature", side="top", font=dict(size=11, color=MUTED))),
        text=[[d.strftime("%b %-d") if not np.isnan(v) else "" for d, v in zip(pd.date_range("2013-01-01", periods=7 * (week.max() + 1)), row)] for row in z],
        hovertemplate="%{z:.0f} °F<extra></extra>", hoverongaps=False,
    ))
    # Month outlines: a stepped path around each month's block of cells.
    for mth in range(1, 13):
        days = d[d.month == mth]
        w0, w1 = week[d.month == mth].min(), week[d.month == mth].max()
        wd0, wd1 = days[0].weekday(), days[-1].weekday()
        path = (f"M {w0 - 0.5},{wd0 - 0.5} H {w0 + 0.5} V -0.5 H {w1 + 0.5} V {wd1 + 0.5} H {w1 - 0.5} V 6.5 H {w0 - 0.5} Z"
                if True else "")
        fig.add_shape(type="path", path=path, line=dict(color=INK, width=1.2))
        fig.add_annotation(x=(w0 + w1) / 2 + 0.3, y=-1.0, text=days[0].strftime("%B"), showarrow=False, font=dict(size=12, color=INK))
    hottest, coldest = daily["temp"].idxmax(), daily["temp"].idxmin()
    for day in (hottest, coldest):  # ring the extremes instead of labelling them in place
        fig.add_shape(type="rect", x0=week[d == day][0] - 0.5, x1=week[d == day][0] + 0.5, y0=day.weekday() - 0.5, y1=day.weekday() + 0.5,
                      line=dict(color=INK, width=2.5))

    fig.update_layout(**base_layout(margin=dict(l=60, r=30, t=140, b=110), plot_bgcolor="white"))
    fig.update_xaxes(visible=False, range=[-0.7, week.max() + 0.7])
    fig.update_yaxes(autorange="reversed", tickvals=[0, 2, 4, 6], ticktext=["Mon", "Wed", "Fri", "Sun"], showgrid=False,
                     tickfont=dict(size=11, color=MUTED), range=[6.7, -1.6], scaleanchor="x", scaleratio=1)
    titles(fig, "A year at JFK, one square per day",
           f"Mean of the hourly temperature readings for each day of 2013. Weeks run left to right; the outlines trace each month.<br>"
           f"Ringed: the coldest day ({day_fmt(coldest)}, {daily.loc[coldest, 'temp']:.0f}°F) and the hottest ({day_fmt(hottest)}, {daily.loc[hottest, 'temp']:.0f}°F).",
           "Source: NOAA ASOS via the nycflights13 R package (weather table). Two days with no observations are left blank.")
    save(CHART_NUM, fig, width=1280, height=560)


def day_fmt(ts):
    return ts.strftime("%-d %B")
Made with Plotly