
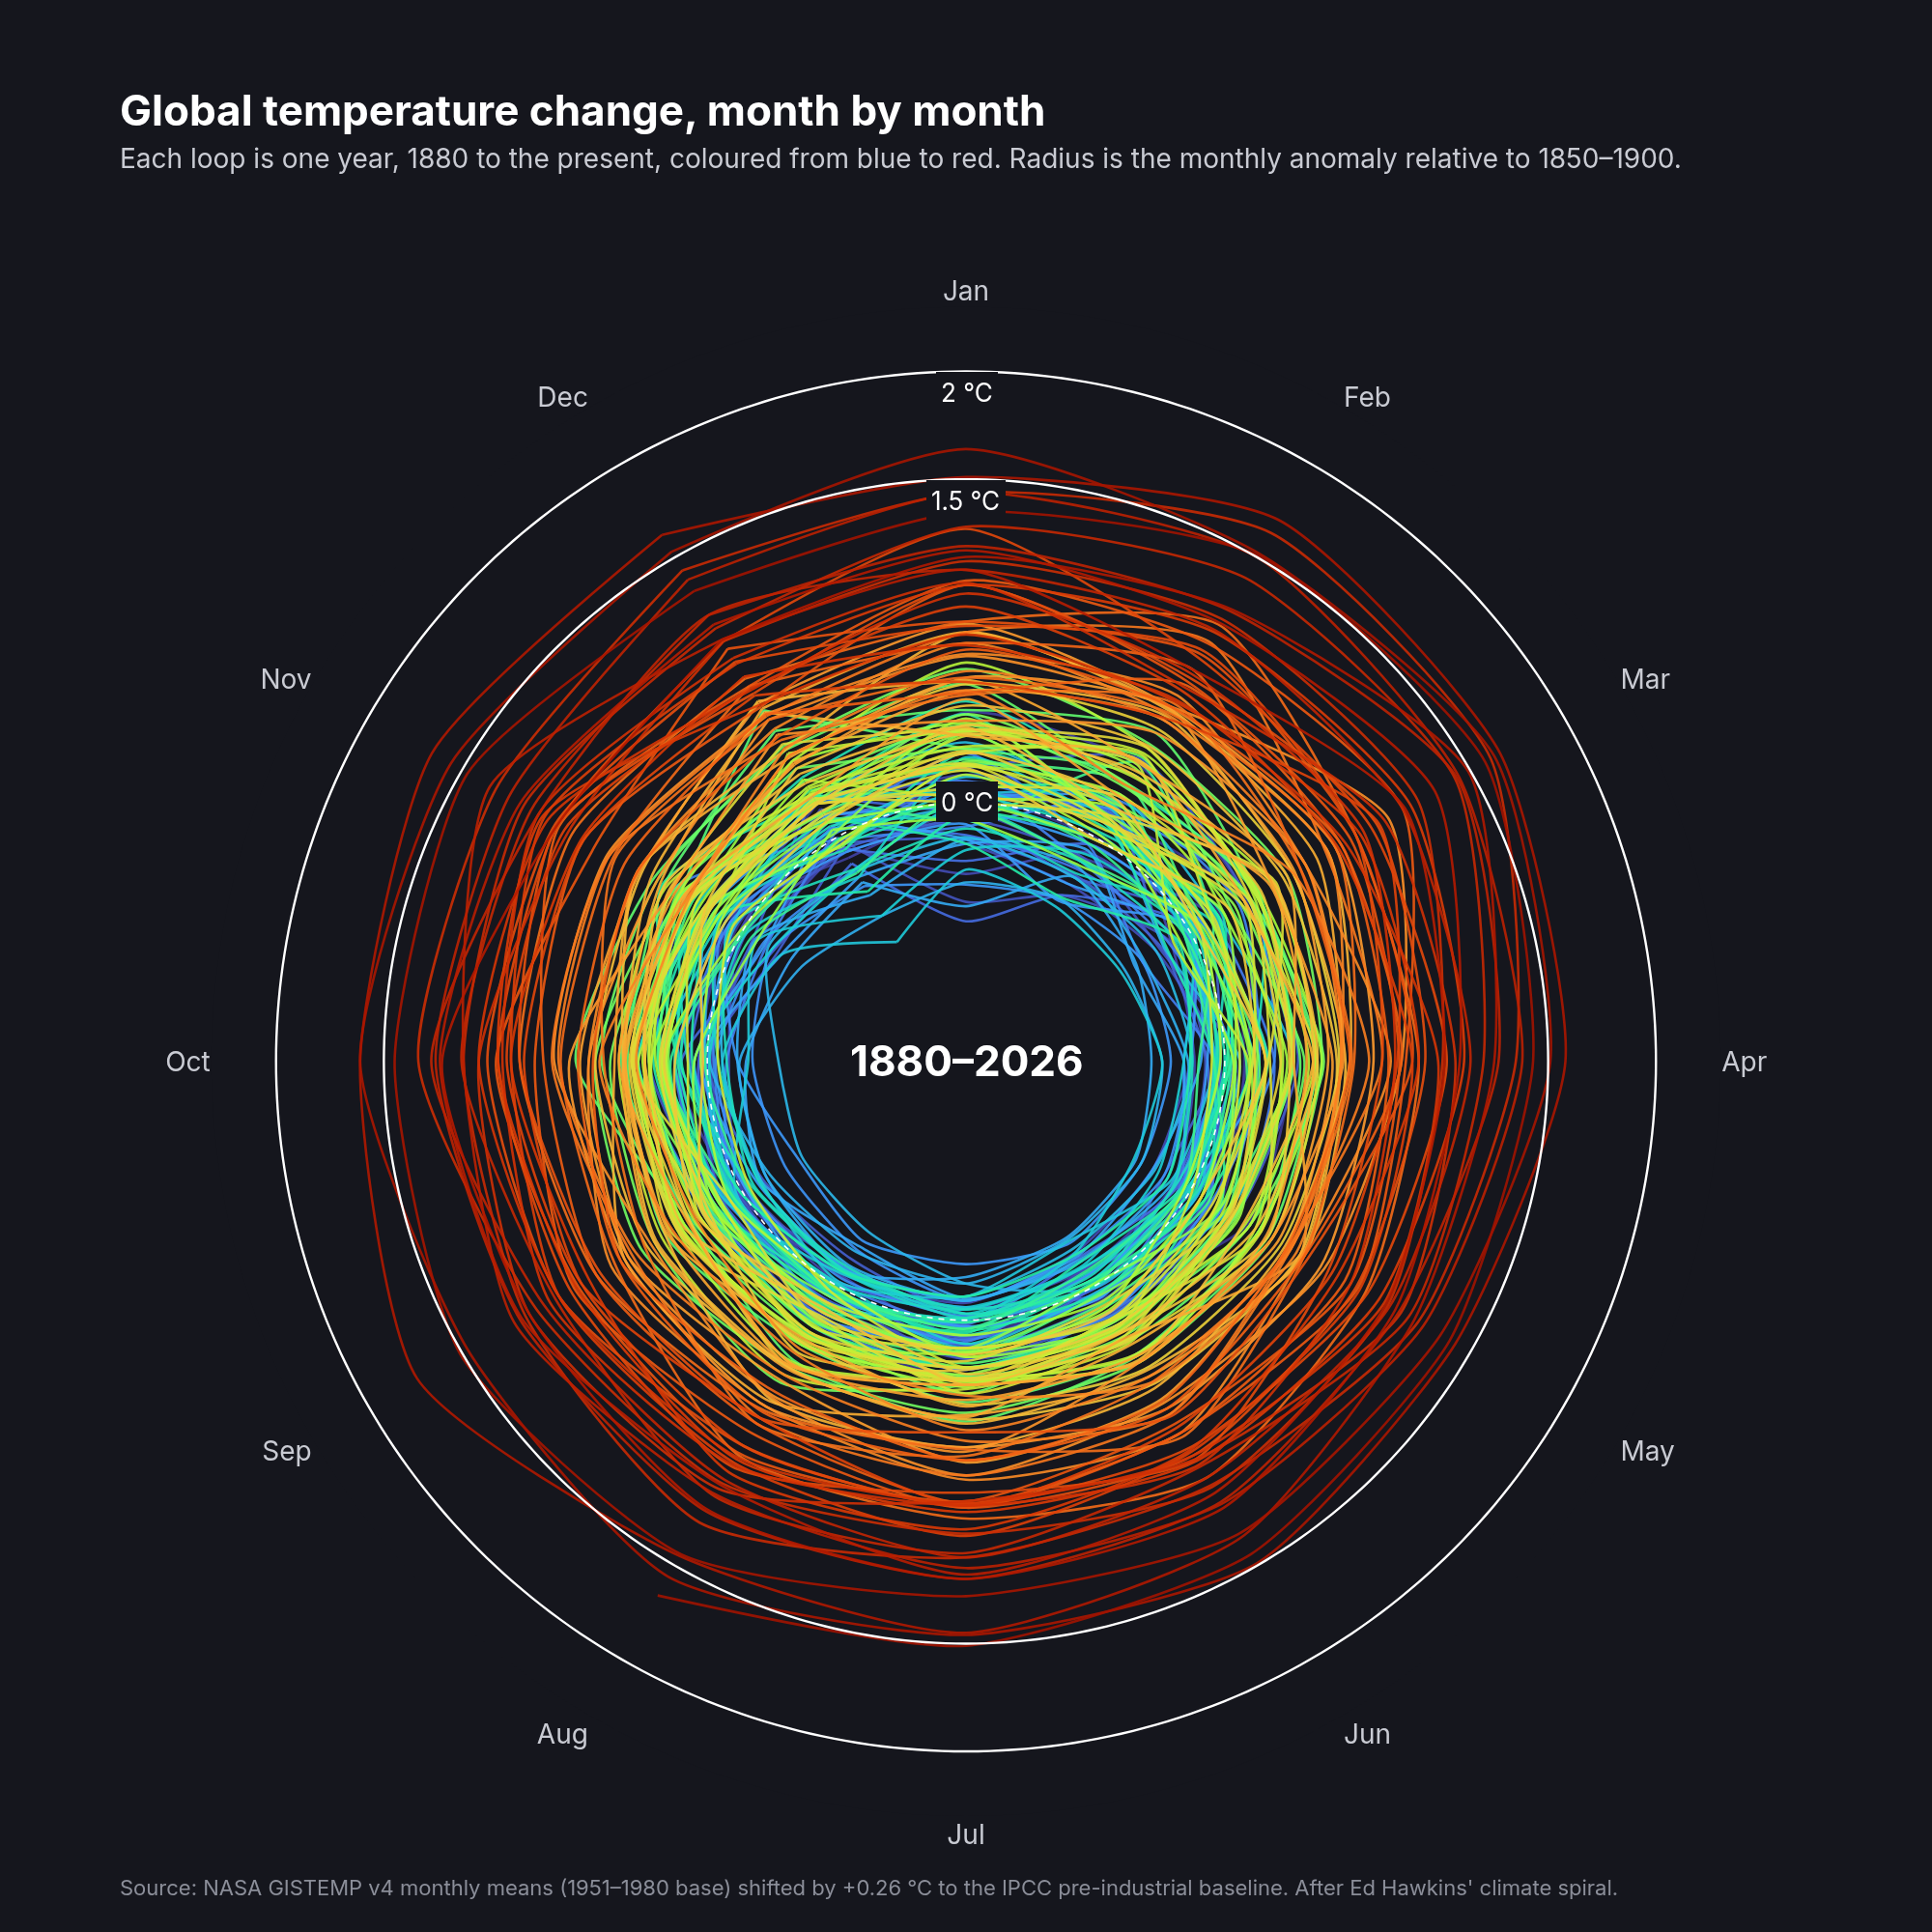
Climate spiral
NASA GISTEMP monthly anomalies wound around a polar axis
Example from Plotly for highly customizable print-ready data visualization · shared helpers
Python Code
"""Climate spiral — NASA GISTEMP monthly anomalies wound around a polar axis.

Ed Hawkins' spiral: one loop per year, twelve months around the circle,
radius = anomaly, colour = year. Dark paper, hand-placed rings for 0, 1.5
and 2 °C, and no polar chrome at all — every gridline is drawn by hand.
"""
from pathlib import Path

from _shared import fetch_text, save, FONT

import io
import numpy as np
import pandas as pd
import plotly.graph_objects as go
import plotly.colors as pc

CHART_NUM = 2
URL = "https://data.giss.nasa.gov/gistemp/tabledata_v4/GLB.Ts+dSST.csv"
MONTHS = ["Jan", "Feb", "Mar", "Apr", "May", "Jun", "Jul", "Aug", "Sep", "Oct", "Nov", "Dec"]
PAPER = "#15161d"
OFFSET = 1.2          # radius = anomaly + OFFSET, so the coldest years still have r > 0
PREIND = 0.26         # 1951–80 → 1850–1900 baseline shift (IPCC AR6 figure)


def generate():
    df = pd.read_csv(io.StringIO(fetch_text(URL)), skiprows=1, na_values="***")
    monthly = df.set_index("Year")[MONTHS].astype(float)

    fig = go.Figure()
    years = monthly.index.to_numpy()
    ramp = pc.sample_colorscale("Turbo", np.linspace(0.05, 0.95, len(years)))
    theta_month = np.arange(12) * 30

    prev_last = None
    for yr, color in zip(years, ramp):
        vals = monthly.loc[yr].to_numpy()
        ok = ~np.isnan(vals)
        r = vals[ok] + PREIND + OFFSET
        th = theta_month[ok]
        # Stitch December of the previous year to January so the spiral is continuous.
        if prev_last is not None:
            r, th = np.r_[prev_last, r], np.r_[-30, th]
        prev_last = r[-1]
        fig.add_trace(go.Scatterpolar(
            r=r, theta=th, mode="lines", name=str(yr),
            line=dict(color=color, width=1.3, shape="spline", smoothing=0.6),
            opacity=0.9, hovertemplate=f"{yr} %{{theta}}: %{{r:.2f}}<extra></extra>",
        ))

    # Reference rings, drawn as their own traces so they sit above the data.
    for lvl, label in [(0, "0 °C"), (1.5, "1.5 °C"), (2.0, "2 °C")]:
        fig.add_trace(go.Scatterpolar(
            r=[lvl + OFFSET] * 361, theta=np.arange(361), mode="lines",
            line=dict(color="white", width=1.2 if lvl else 0.8, dash="solid" if lvl else "dot"),
            hoverinfo="skip",
        ))
        fig.add_annotation(
            x=0.5, y=0.465 + 0.465 * (lvl + OFFSET) / (2.3 + OFFSET), xref="paper", yref="paper",
            text=label, showarrow=False, font=dict(size=13, color="white", family=FONT),
            bgcolor=PAPER, borderpad=2,
        )

    last = years[-1]
    fig.add_annotation(x=0.5, y=0.465, xref="paper", yref="paper", text=f"<b>{years[0]}–{last}</b>",
                       showarrow=False, font=dict(size=22, color="white", family=FONT))

    fig.update_layout(
        paper_bgcolor=PAPER, plot_bgcolor=PAPER, showlegend=False,
        font=dict(family=FONT, color="white"),
        margin=dict(l=60, r=60, t=100, b=60),
        polar=dict(
            bgcolor=PAPER, domain=dict(x=[0.035, 0.965], y=[0.0, 0.93]),
            radialaxis=dict(visible=False, range=[0, 2.3 + OFFSET]),
            angularaxis=dict(direction="clockwise", rotation=90, tickmode="array",
                             tickvals=theta_month, ticktext=MONTHS, showgrid=False,
                             showline=False, tickfont=dict(size=14, color="#c9cbd3"), ticks=""),
        ),
        annotations=list(fig.layout.annotations) + [
            dict(x=0, y=1.0, xref="paper", yref="paper", xanchor="left", yanchor="bottom", yshift=28,
                 text="<b>Global temperature change, month by month</b>", showarrow=False,
                 font=dict(size=22, color="white")),
            dict(x=0, y=1.0, xref="paper", yref="paper", xanchor="left", yanchor="bottom", yshift=8,
                 text="Each loop is one year, 1880 to the present, coloured from blue to red. "
                      "Radius is the monthly anomaly relative to 1850–1900.", showarrow=False,
                 font=dict(size=14, color="#c9cbd3")),
            dict(x=0, y=0, xref="paper", yref="paper", xanchor="left", yanchor="top", yshift=-28,
                 text="Source: NASA GISTEMP v4 monthly means (1951–1980 base) shifted by +0.26 °C to the "
                      "IPCC pre-industrial baseline. After Ed Hawkins' climate spiral.",
                 showarrow=False, font=dict(size=11, color="#8b8e99")),
        ],
    )
    save(CHART_NUM, fig, width=1000, height=1000)
Made with Plotly