
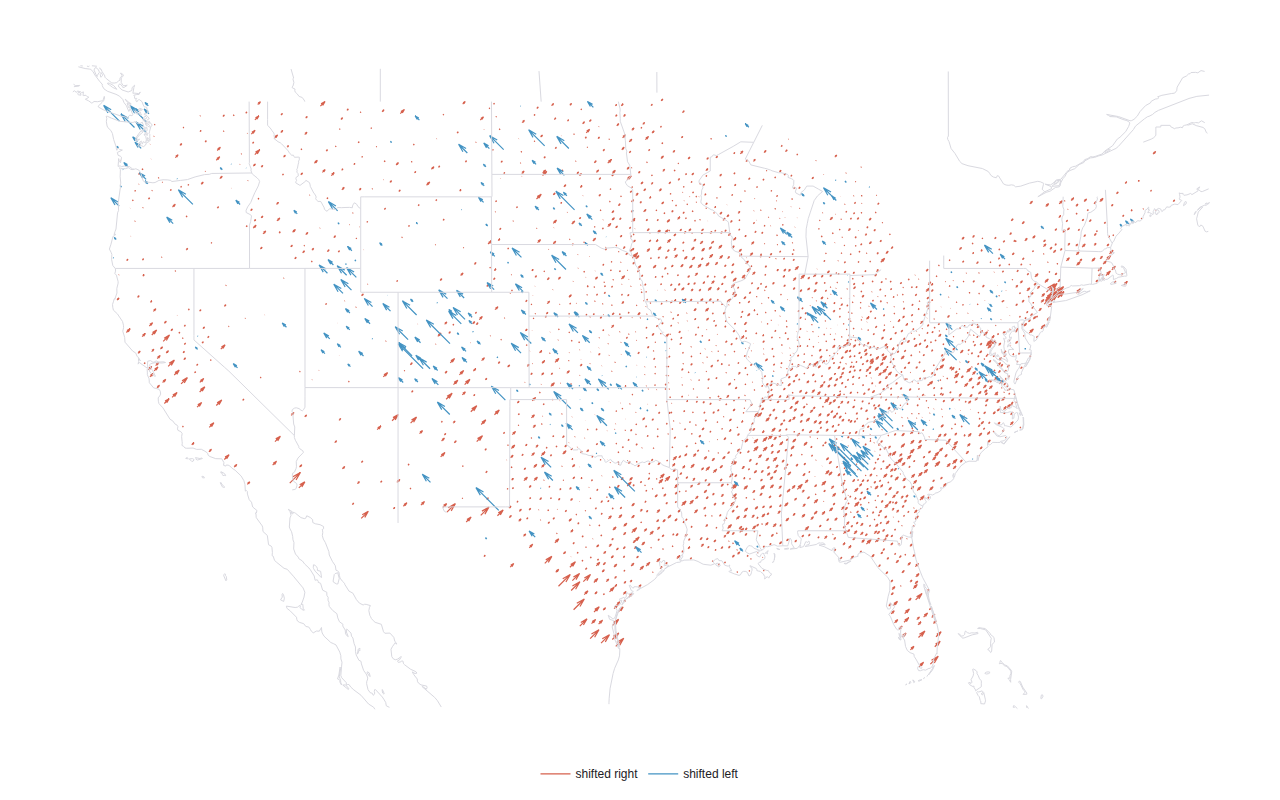
County swing arrows
how the presidential vote shifted, 2020 → 2024
Example from a field guide to quiver · shared helpers
Python Code
"""County swing arrows — how the presidential vote shifted, 2020 → 2024."""
from pathlib import Path

from _shared import fetch_csv, fetch_json, save, outline_trace, themed_layout, MUTED

import numpy as np

CHART_NUM = 15

# County-level presidential returns (tonmcg's compilation of certified results)
BASE = "https://raw.githubusercontent.com/tonmcg/US_County_Level_Election_Results_08-24/master"
URL_2020 = f"{BASE}/2020_US_County_Level_Presidential_Results.csv"
URL_2024 = f"{BASE}/2024_US_County_Level_Presidential_Results.csv"
COUNTIES = "https://raw.githubusercontent.com/plotly/datasets/master/geojson-counties-fips.json"

RED = "#d6604d"   # shifted toward the Republican candidate
BLUE = "#4393c3"  # shifted toward the Democratic candidate
TILT = np.deg2rad(45)  # the classic tilt: arrows lean 45° off vertical


def centroids():
    """County centroid lookup from the plotly counties GeoJSON."""
    gj = fetch_json(COUNTIES)
    out = {}
    for f in gj["features"]:
        geom = f["geometry"]
        rings = (
            [geom["coordinates"][0]]
            if geom["type"] == "Polygon"
            else [poly[0] for poly in geom["coordinates"]]
        )
        ring = max(rings, key=len)
        lon = sum(p[0] for p in ring) / len(ring)
        lat = sum(p[1] for p in ring) / len(ring)
        out[f["id"]] = (lon, lat)
    return out

def generate():
    print("fetching county returns 2020 + 2024 …")
    d20 = fetch_csv(URL_2020, dtype={"county_fips": str})
    d24 = fetch_csv(URL_2024, dtype={"county_fips": str})
    for d in (d20, d24):
        d["county_fips"] = d["county_fips"].str.zfill(5)
        d["margin"] = d["per_gop"] - d["per_dem"]
    df = d20[["county_fips", "county_name", "state_name", "margin"]].merge(
        d24[["county_fips", "margin"]], on="county_fips", suffixes=("_20", "_24")
    )
    df["swing"] = df["margin_24"] - df["margin_20"]

    print("computing county centroids …")
    cent = centroids()
    df["lon"] = [cent.get(f, (np.nan,))[0] for f in df["county_fips"]]
    df["lat"] = [cent.get(f, (np.nan, np.nan))[1] for f in df["county_fips"]]
    df = df.dropna(subset=["lon", "lat"])
    # Lower 48 only — Alaska reports by district and Hawaii floats off-frame
    df = df[~df["county_fips"].str.startswith(("02", "15"))]
    print(f"  {len(df)} counties · median swing {df['swing'].median() * 100:+.1f} pts")

    traces = []
    for name, sel, color in [
        ("shifted right", df["swing"] >= 0, RED),
        ("shifted left", df["swing"] < 0, BLUE),
    ]:
        d = df[sel]
        m = d["swing"].abs()
        traces.append({
            "type": "quiver",
            "name": name,
            "x": d["lon"].tolist(),
            "y": d["lat"].tolist(),
            # every arrow leans 45° — right for R, left for D — length = swing
            "u": (np.sign(d["swing"]) * m * np.sin(TILT)).tolist(),
            "v": (m * np.cos(TILT)).tolist(),
            "arrowref": "paper",
            "lengthmode": "scaled",
            "lengthfactor": 1.15,
            "marker": {"color": color, "line": {"width": 1.2}},
            "customdata": [
                f"{c}, {s} · {'R' if sw >= 0 else 'D'}+{abs(sw) * 100:.1f} since 2020"
                for c, s, sw in zip(d["county_name"], d["state_name"], d["swing"])
            ],
            "hovertemplate": "%{customdata}<extra></extra>",
        })

    pad = (-126.5, 23.5, -65.5, 50.5)
    coast = outline_trace("coastline", bbox=pad)
    states = outline_trace("states", bbox=pad)

    layout = themed_layout(
        xaxis={"visible": False},
        yaxis={"visible": False, "scaleanchor": "x", "scaleratio": 1.28},
        legend={"x": 0.5, "y": -0.02, "xanchor": "center", "orientation": "h"},
        margin={"t": 30, "b": 30, "l": 30, "r": 30},
    )
    save(CHART_NUM, {"data": [coast, states] + traces, "layout": layout})
Made with Plotly