
Quiver Plots in Plotly
Plotly.js 4.0.0 is out and it features a brand new trace type: quiver plots.
We’ve long had workarounds for creating these plots and we’re excited to finally have this be a first-class trace type.
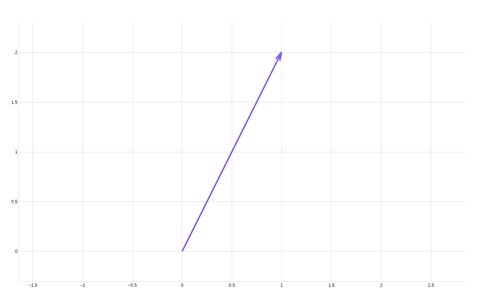
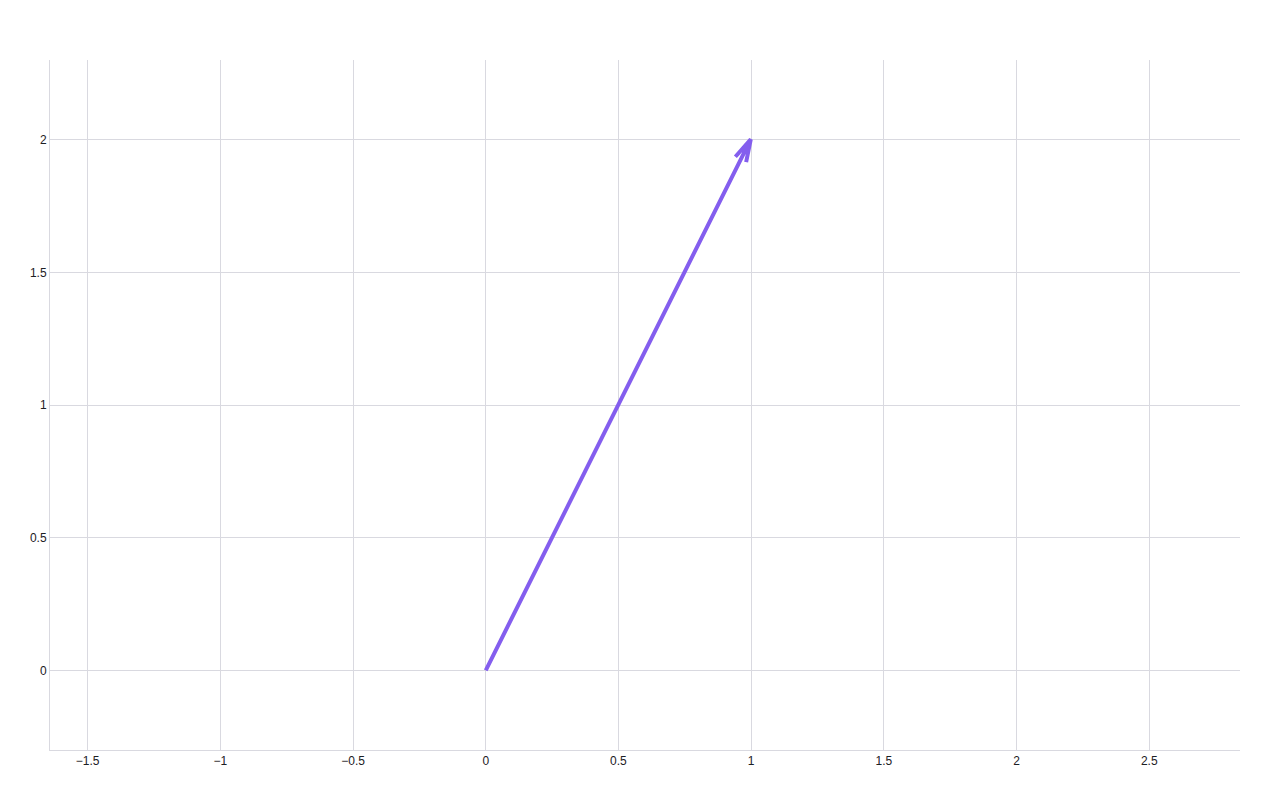
Also known as vector plots, quiver plots show a series of arrows to visualize vector fields. Each “point” has (x, y) (the position of the root of the arrow) as well as (u, v) (the end position of its arrow). Here’s the simplest one:
{
  "x": [0], "y": [0], "u": [1], "v": [2], "type": "quiver"
}
x=[0], y=[0], u=[1], v=[2] · Code
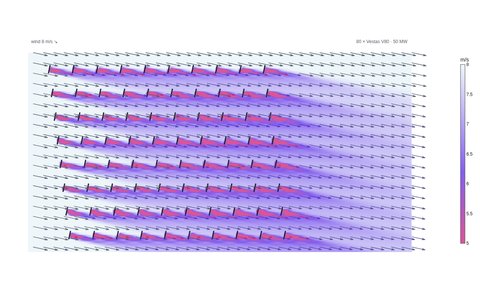
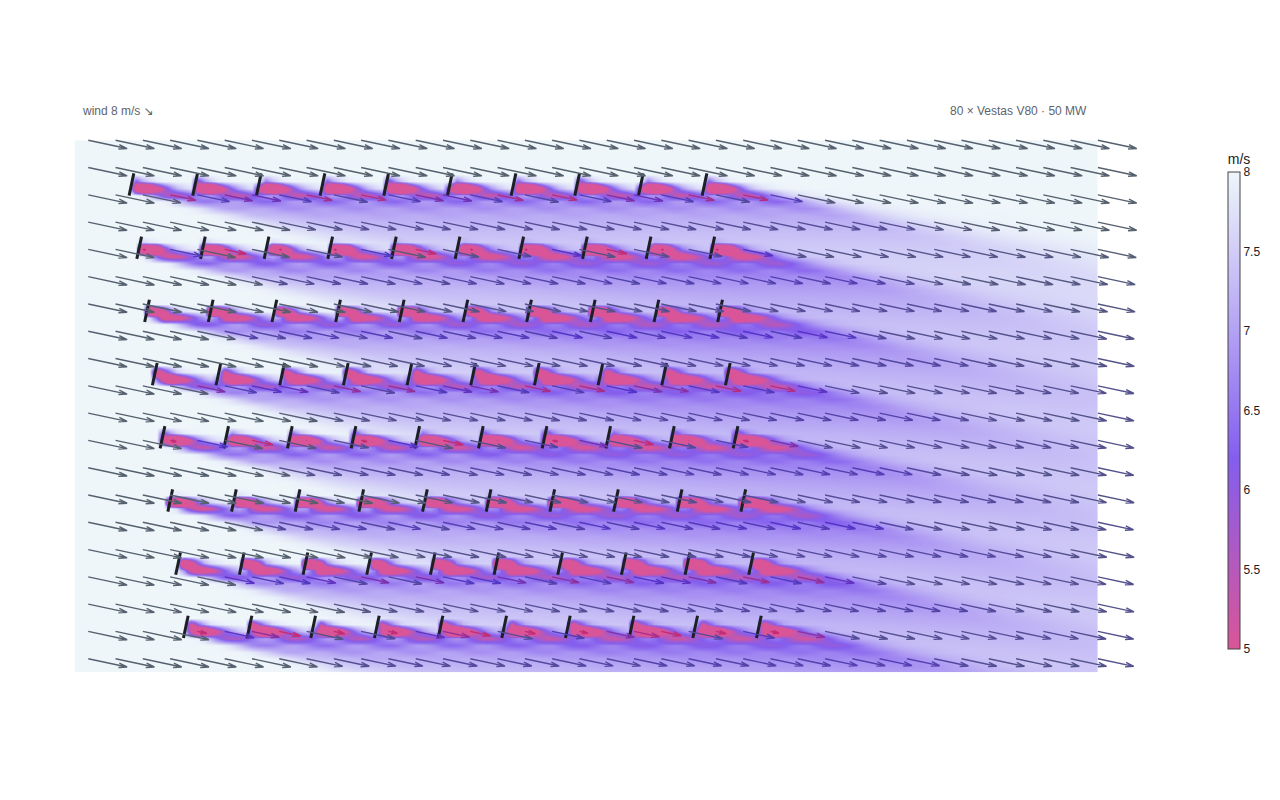
The interpretation is often that longer “arrows” (vectors!) represent “larger” forces and smaller arrows represent “smaller” forces. Coloring the arrows by their magnitude is also a nice way to get the point across.
Horns Rev 1 layout via PyWake · Bastankhah–Porté-Agel wake model, 8 m/s · Code
PyWake · a single Vestas V80, vertical slice through the wake · Code
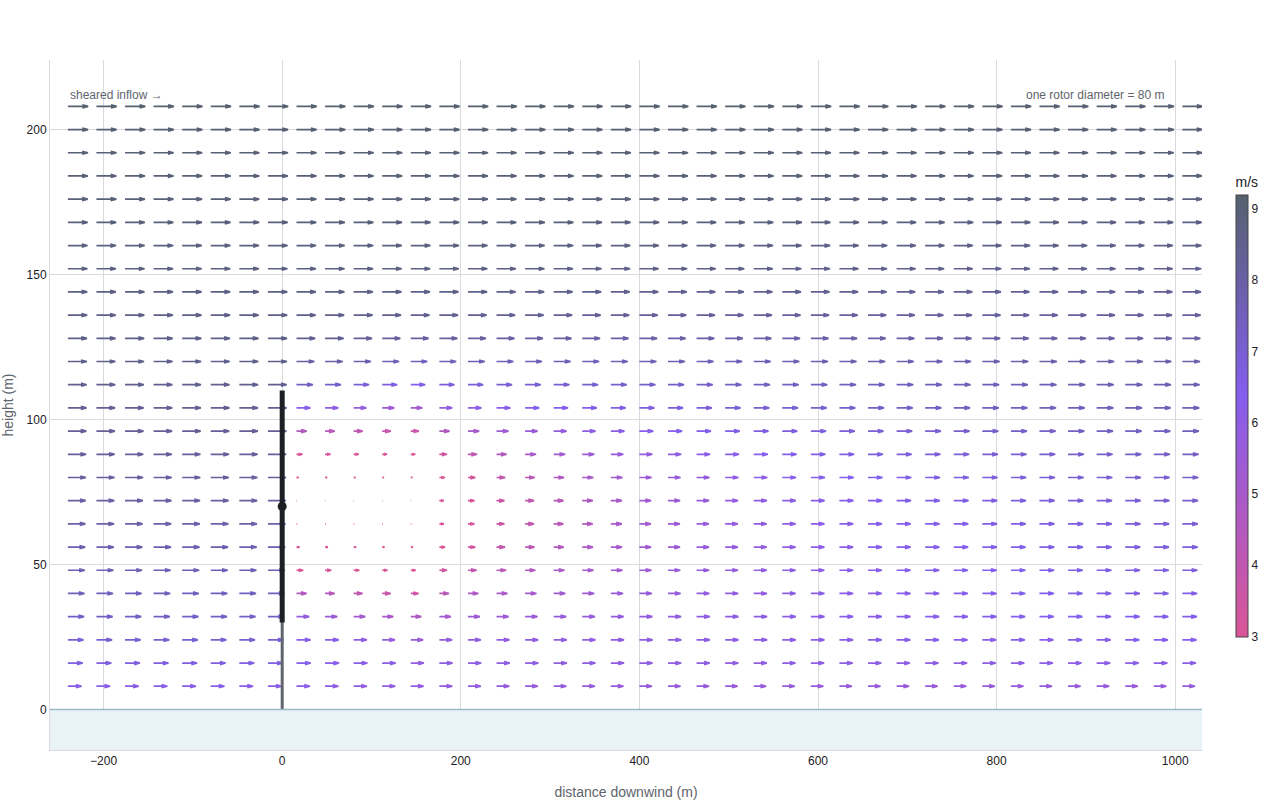
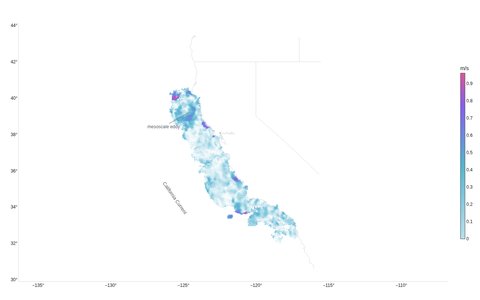
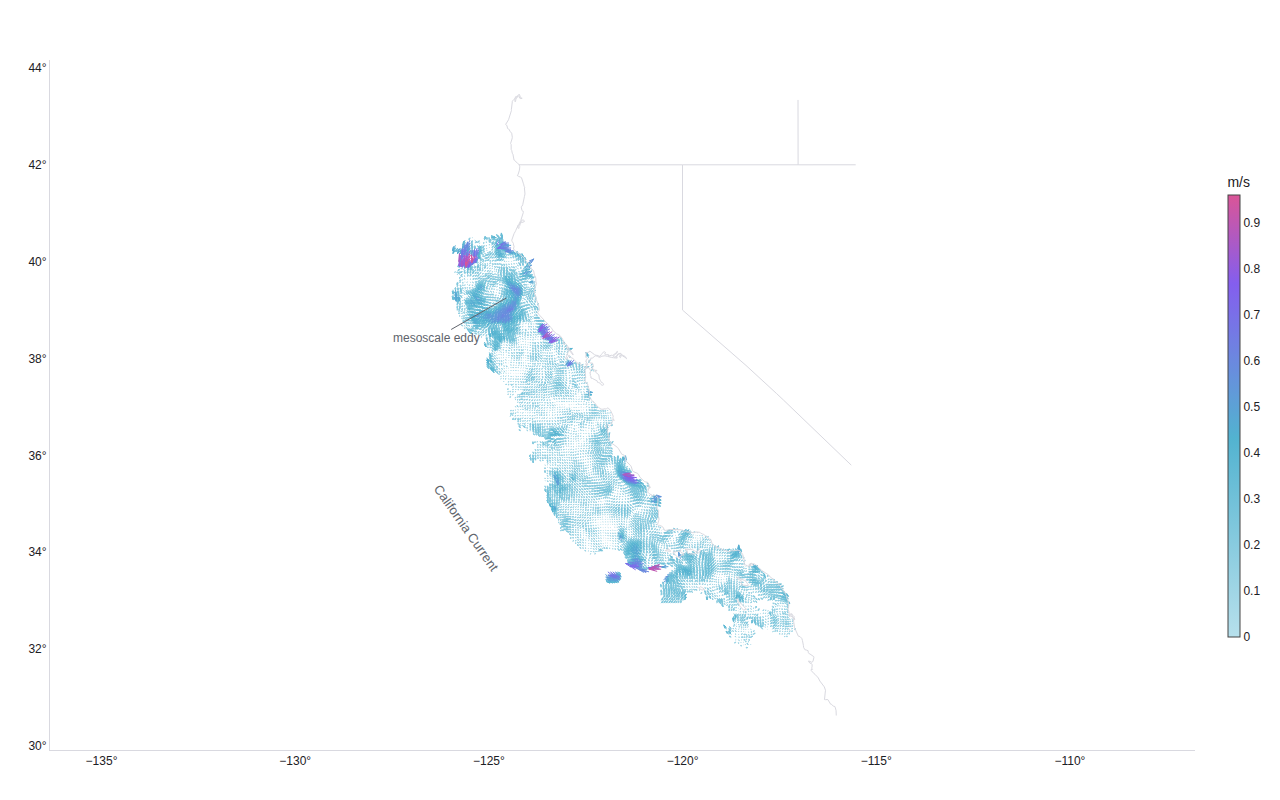
The most relatable vector plots are wind & currents. Here’s the currents on coast of California:
NOAA HFRNet coastal HF radar · 6 km mosaic · 2026-08-13 21:00Z · Code
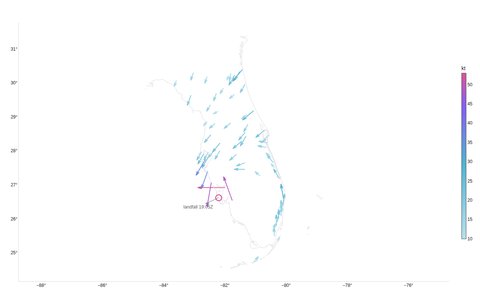
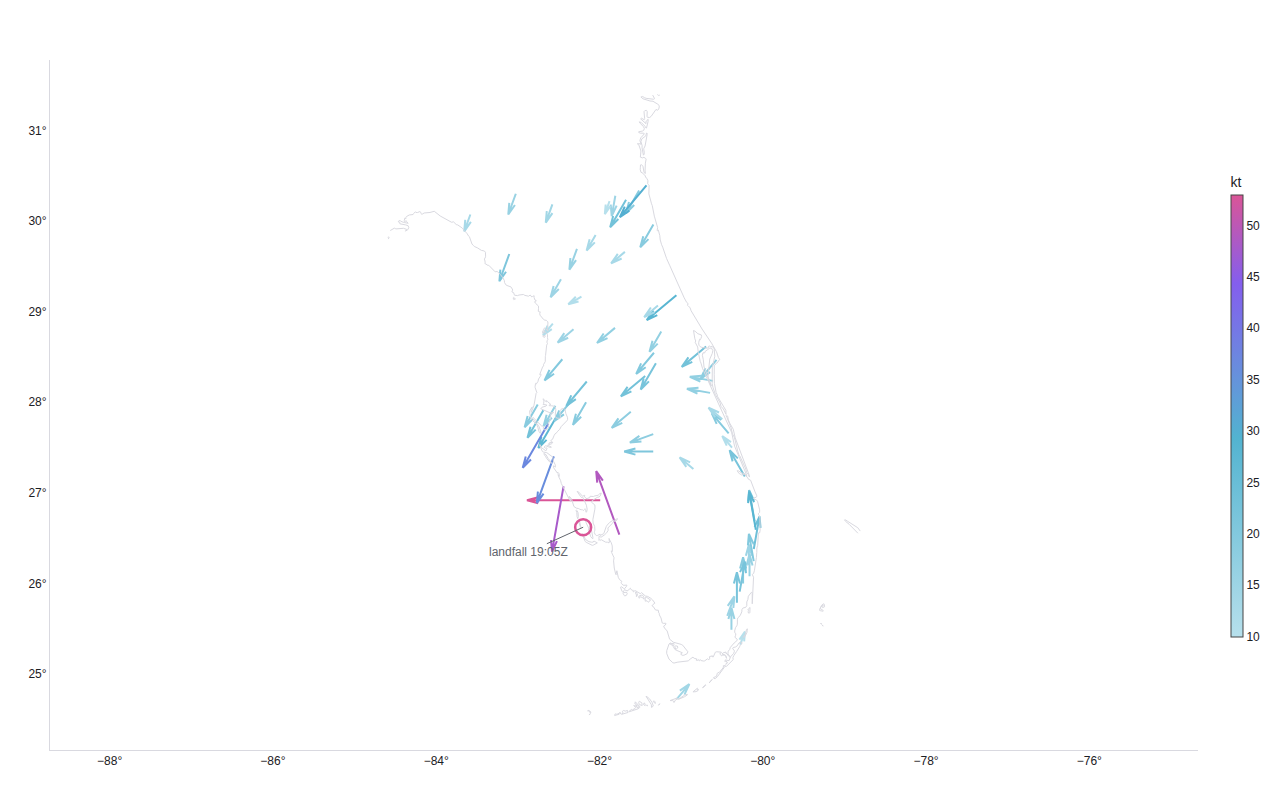
and wind in Florida:
Iowa Mesonet ASOS · Florida network · 2022-09-28 18:40–19:10Z · Code
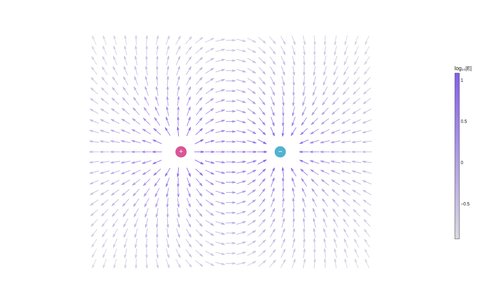
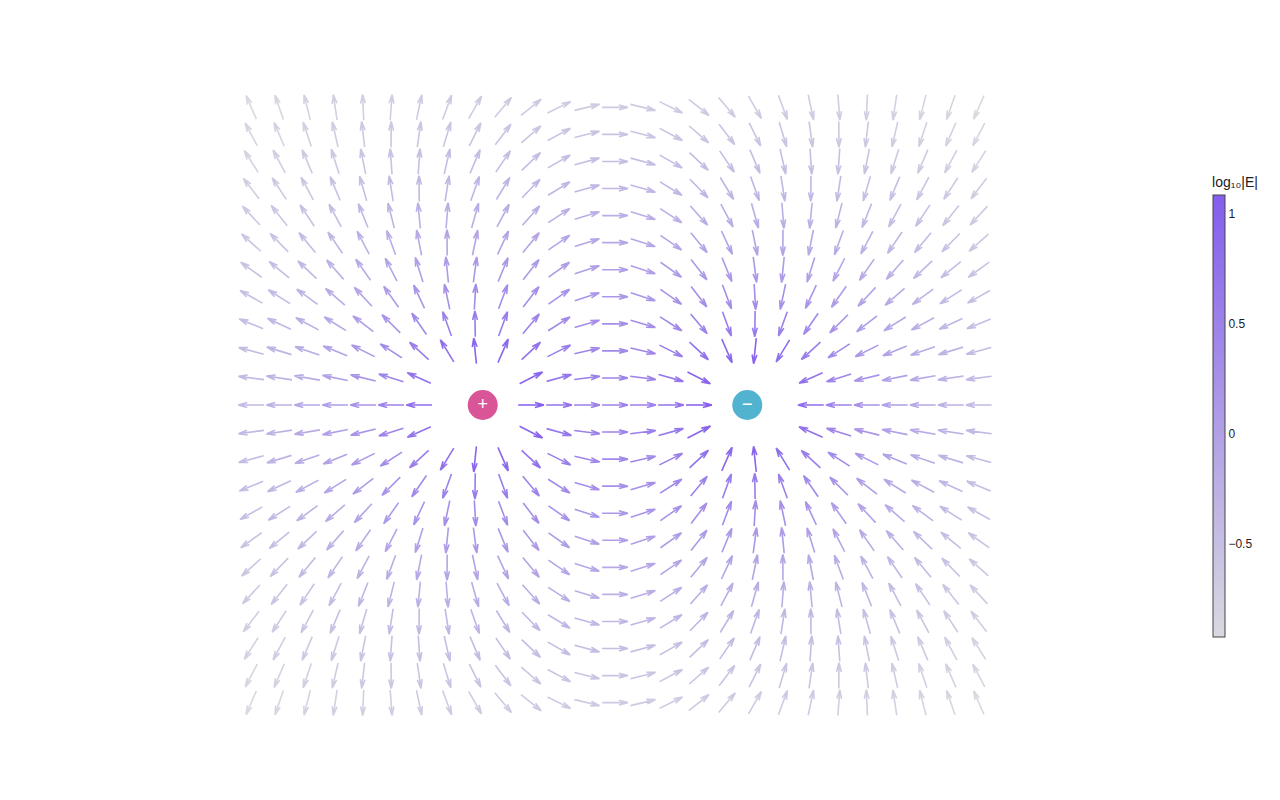
Our world is full of various forces and things in motion. Electromagnetic is another classic example:
Computed — Coulomb's law, two point charges · Code
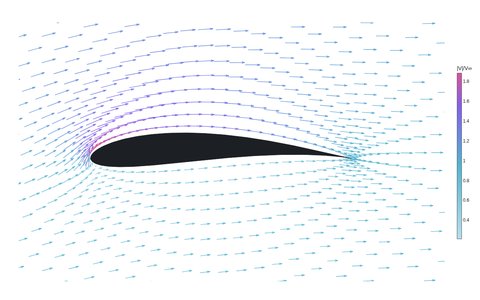
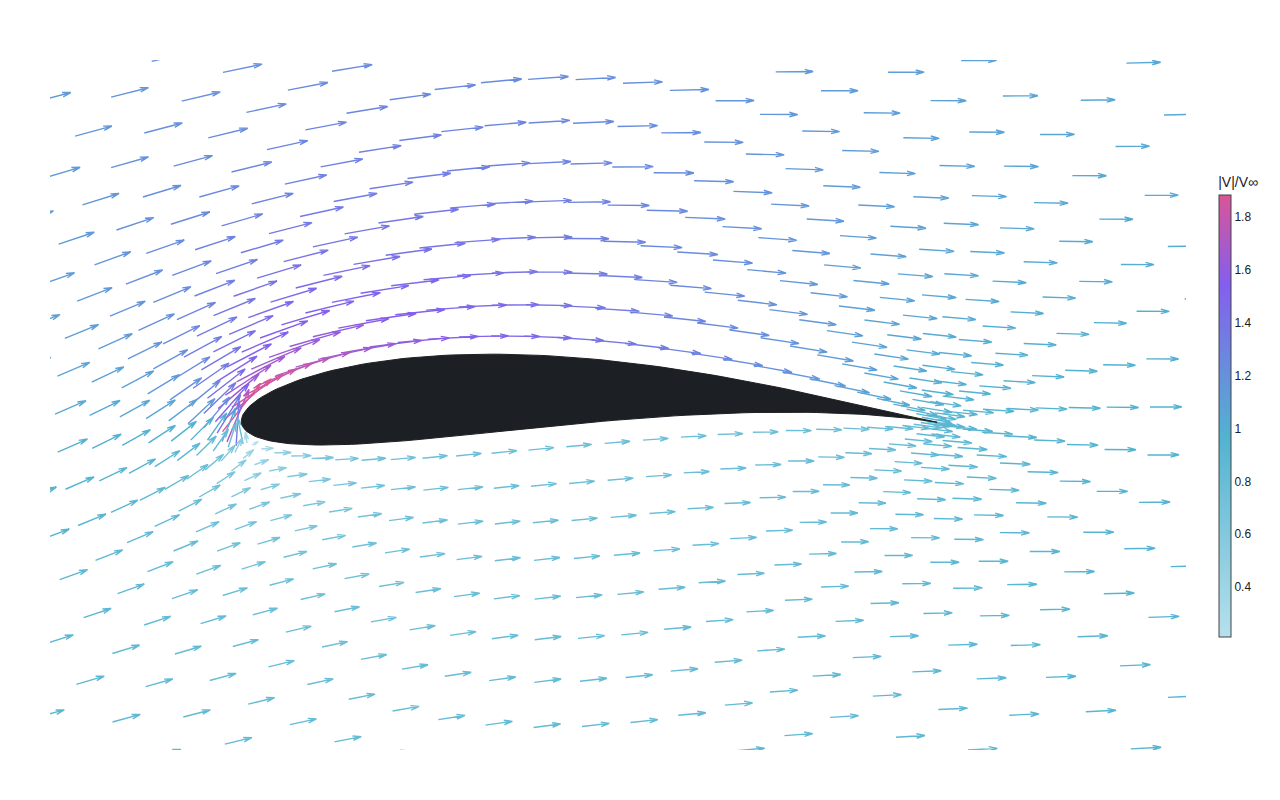
and fluid dynamics on a smaller scale, like airfoil lift and aerodynamics:
Computed — Joukowski conformal map, Kutta condition, 8° angle of attack · Code
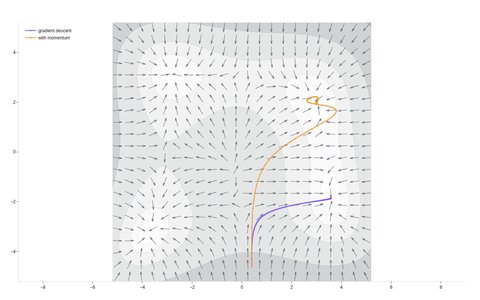
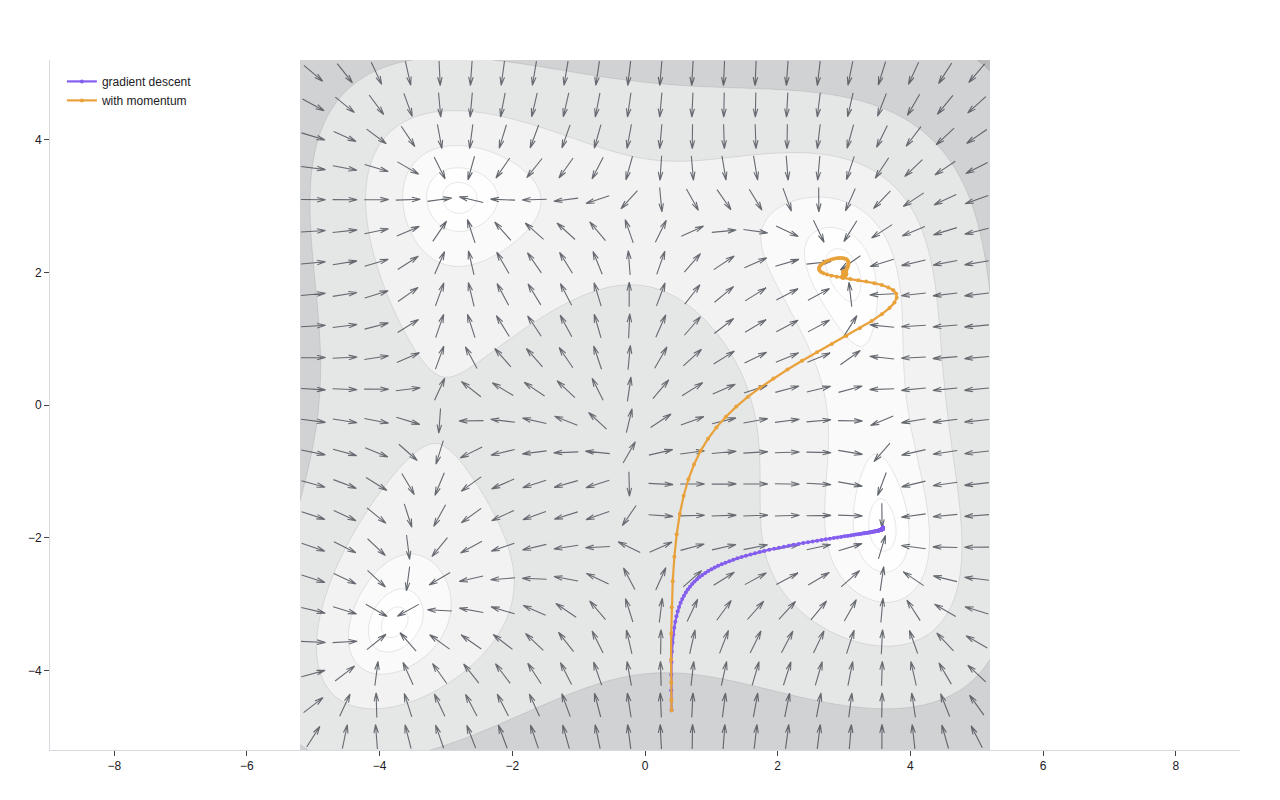
They’re useful in mathematics for visualizing parameterized plots (visualizing systems that evolve over time), like the now-famous gradient descent algorithms:
Computed — Himmelblau's function, 220 steps per optimizer · Code
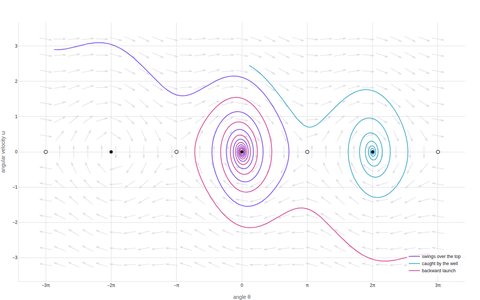
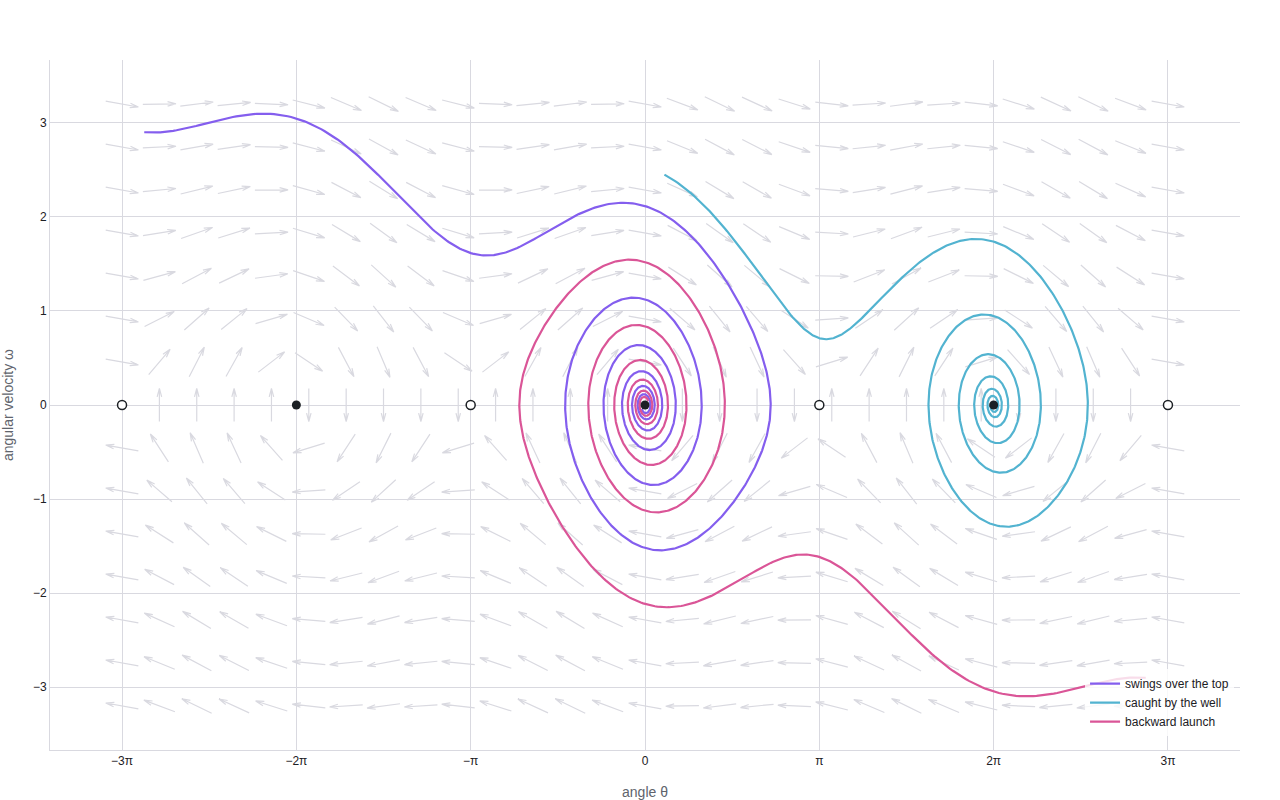
and developing an intuition about dynamical systems and steady state points and local minima/maxima:
Computed — damped pendulum, RK4 trajectories · Code
But at the end of the day, they’re arrows.
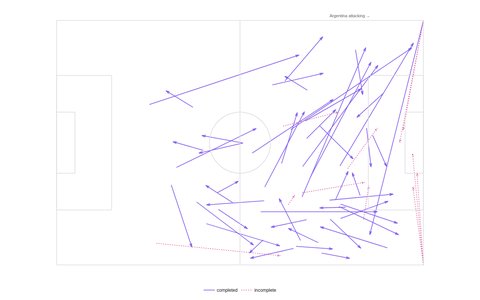
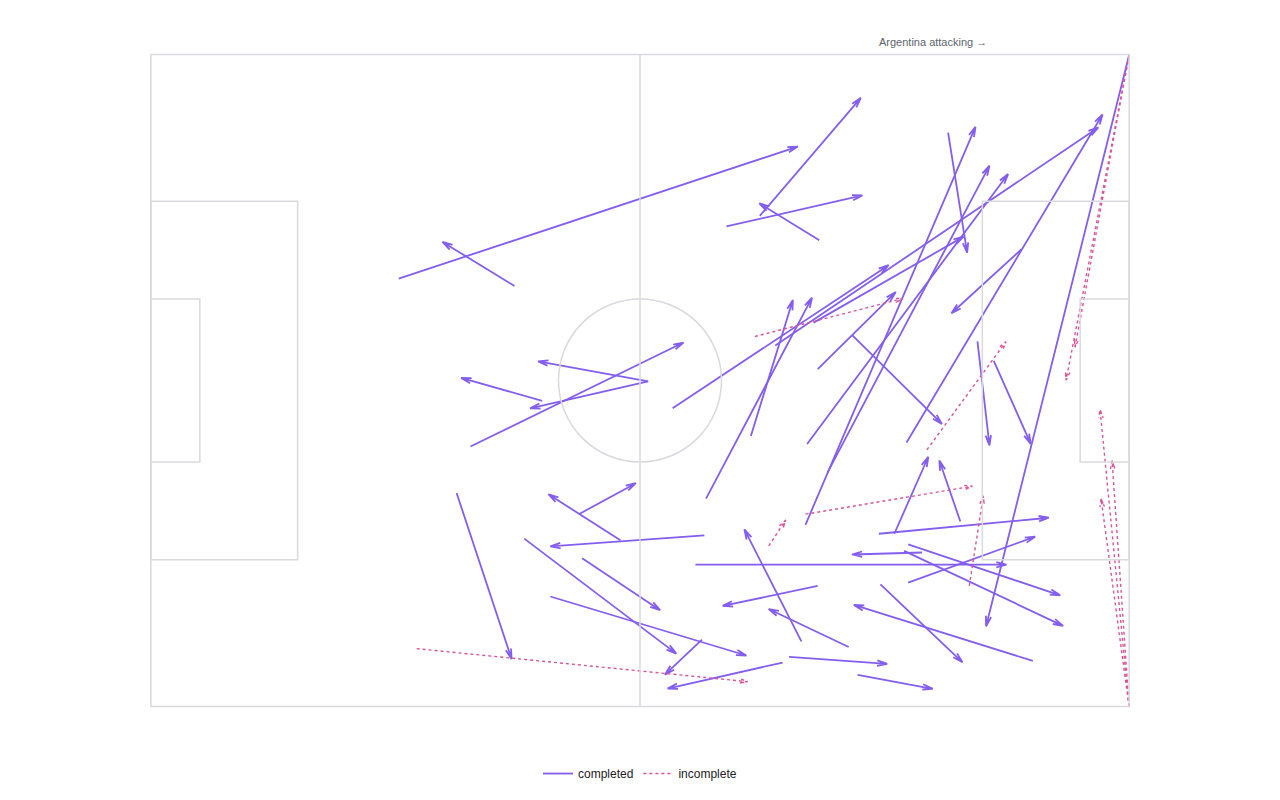
If you think about what you might draw with arrows on a piece of paper then why not use vector plots for things like sports passes!
StatsBomb Open Data · Argentina–France, 2022 World Cup final · Code
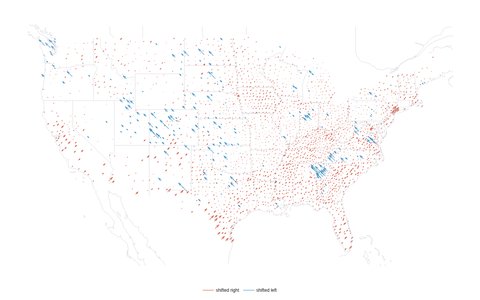
The New York Times graphics department famously visualized the change of the electorate with vector plots, showing how much various places swung left or right.
County presidential returns · 2020 → 2024 · after the classic New York Times county swing map · Code
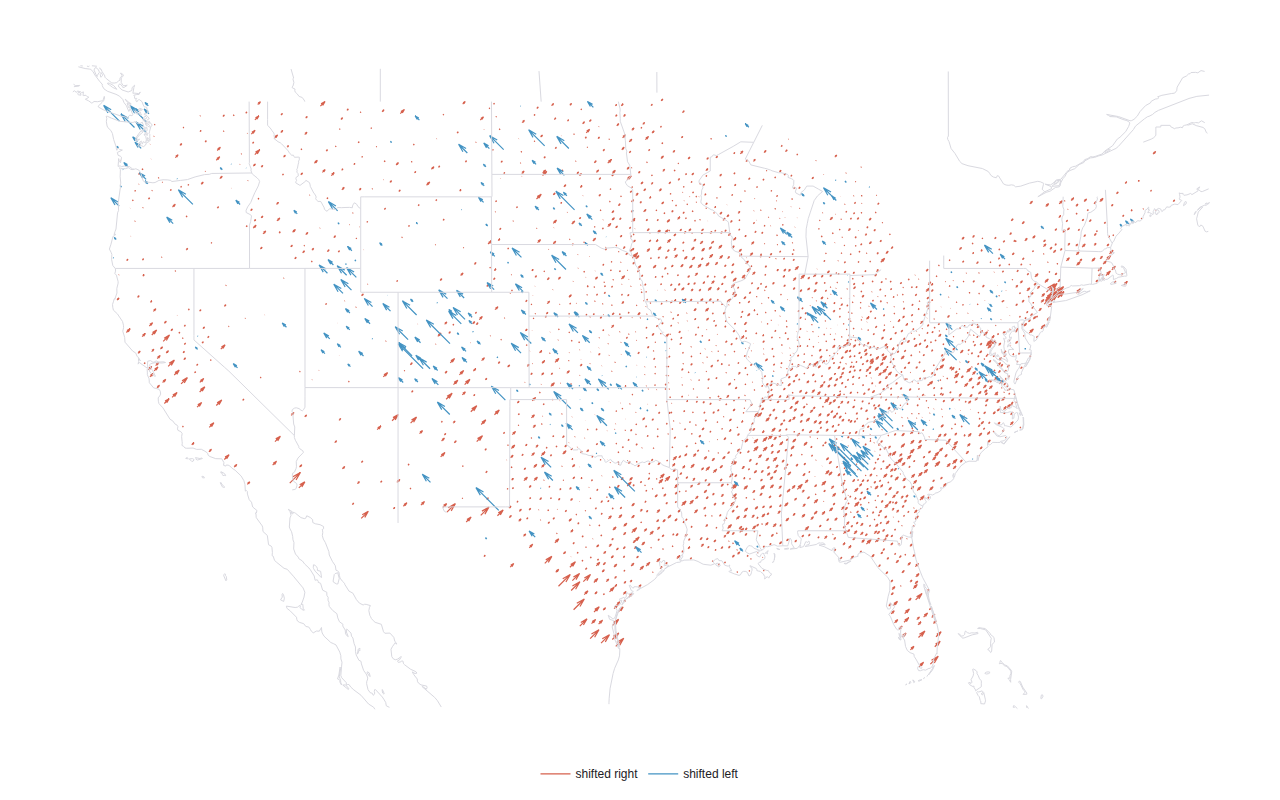
If we’re being pedantic, note that this plot only uses 1/2 of the “data encodings” in the arrow: it’s keeping the angle of the arrow constant (either left or right) while only changing the magnitude of the arrow. And that’s OK! It’s quite an effective plot nonetheless.
The release is available here: https://cdn.plot.ly/plotly-4.0.0.min.js. We should have support in the plotly.py python library available shortly as well.
So, what vector plots did I miss and which ones are your favorite? Let me know in the forum.
Personally, I’m interested in developing some higher resolution water current plots. I open water swim in the ocean at a shoreline where there is a sort of famous “back eddy”, meaning that if you swim out too far the current switches direction (which can be quite dangerous!). This eddy changes throughout the day as the tide changes. There are a few great apps that visualize this (I’ve bought the Saildrone Forecast App) but I’d be curious to try to model it myself. Can it be done through data collection on the publicly available NOAA buoy data feeds or does it have to be done by approximation in a fluid dynamics model based off of the tides? I’m not sure! These are questions I didn’t have before this plot type.