
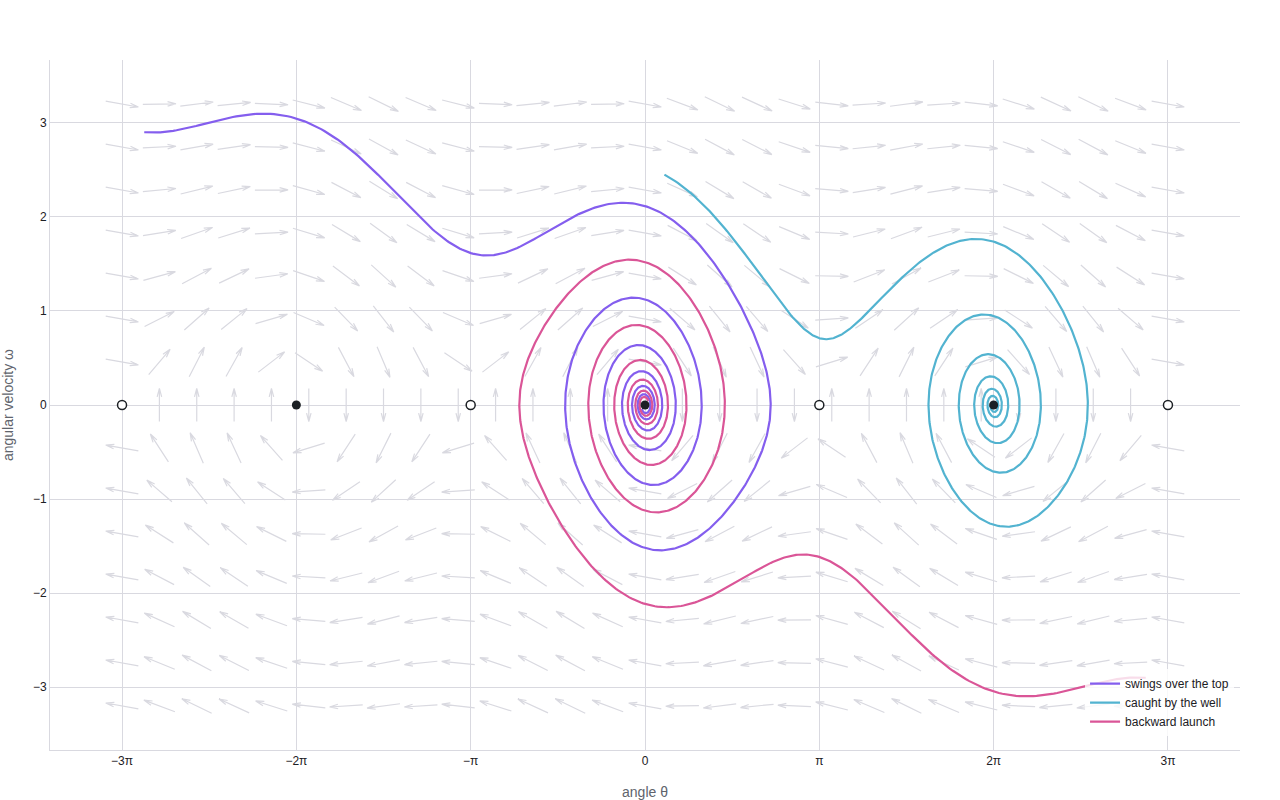
The pendulum's phase portrait
a direction field on axes that aren't space
Example from a field guide to quiver · shared helpers
Python Code
"""The pendulum's phase portrait — a direction field on axes that aren't space."""
from pathlib import Path

from _shared import save, themed_layout, GRID, MUTED, VIOLET, TEAL, PINK, TEXT

import numpy as np

CHART_NUM = 8

DAMPING = 0.18

def deriv(theta, omega):
    return omega, -np.sin(theta) - DAMPING * omega


def generate():
    # Direction field over (θ, ω) — angle on x, angular velocity on y.
    PI = np.pi
    thetas = np.linspace(-3 * PI, 3 * PI, 29)
    omegas = np.linspace(-3.2, 3.2, 15)
    TH, OM = [a.ravel() for a in np.meshgrid(thetas, omegas)]
    dth, dom = deriv(TH, OM)
    mag = np.hypot(dth, dom) + 1e-9

    arrows = {
        "type": "quiver",
        "x": TH.tolist(),
        "y": OM.tolist(),
        "u": (dth / mag).tolist(),
        "v": (dom / mag).tolist(),
        # θ is radians, ω is radians/second: the axes have different units, so
        # only paper mode gives arrows a meaningful on-screen angle.
        "arrowref": "paper",
        "lengthmode": "scaled",
        "lengthfactor": 0.85,
        "anchor": "center",
        "marker": {"color": GRID, "line": {"width": 1.2}},
        "hoverinfo": "skip",
        "showlegend": False,
    }

    # A few trajectories, integrated with RK4, spiraling into the wells
    def integrate(theta0, omega0, T=42.0, dt=0.02):
        th, om = theta0, omega0
        out = [(th, om)]
        for _ in range(int(T / dt)):
            k1 = deriv(th, om)
            k2 = deriv(th + dt / 2 * k1[0], om + dt / 2 * k1[1])
            k3 = deriv(th + dt / 2 * k2[0], om + dt / 2 * k2[1])
            k4 = deriv(th + dt * k3[0], om + dt * k3[1])
            th += dt / 6 * (k1[0] + 2 * k2[0] + 2 * k3[0] + k4[0])
            om += dt / 6 * (k1[1] + 2 * k2[1] + 2 * k3[1] + k4[1])
            out.append((th, om))
        return out

    ics = [
        ("swings over the top", (-3 * PI + 0.4, 2.9), VIOLET),
        ("caught by the well", (0.35, 2.45), TEAL),
        ("backward launch", (3 * PI - 0.4, -2.9), PINK),
    ]
    trajectories = []
    for name, (t0, o0), color in ics:
        path = integrate(t0, o0)
        px, py = zip(*path)
        trajectories.append({
            "type": "scatter",
            "name": name,
            "x": px,
            "y": py,
            "mode": "lines",
            "line": {"color": color, "width": 2.2},
            "hoverinfo": "skip",
        })

    # Fixed points: attracting wells at even multiples of π, saddles at odd
    wells = {
        "type": "scatter",
        "x": [-2 * PI, 0, 2 * PI], "y": [0, 0, 0],
        "mode": "markers",
        "marker": {"size": 9, "color": TEXT},
        "hovertemplate": "stable equilibrium<extra></extra>",
        "showlegend": False,
    }
    saddles = {
        "type": "scatter",
        "x": [-3 * PI, -PI, PI, 3 * PI], "y": [0, 0, 0, 0],
        "mode": "markers",
        "marker": {"size": 9, "color": "#ffffff",
                   "line": {"color": TEXT, "width": 1.5}},
        "hovertemplate": "unstable equilibrium<extra></extra>",
        "showlegend": False,
    }

    ticks = [-3 * PI, -2 * PI, -PI, 0, PI, 2 * PI, 3 * PI]
    labels = ["−3π", "−2π", "−π", "0", "π", "2π", "3π"]
    layout = themed_layout(
        xaxis={"tickvals": ticks, "ticktext": labels, "zeroline": False,
               "title": {"text": "angle θ", "font": {"color": MUTED}}},
        yaxis={"zeroline": False,
               "title": {"text": "angular velocity ω", "font": {"color": MUTED}}},
        legend={"x": 0.995, "y": 0.02, "xanchor": "right",
                "bgcolor": "rgba(255,255,255,0.8)"},
    )
    save(CHART_NUM, {
        "data": [arrows] + trajectories + [wells, saddles],
        "layout": layout,
    })
Made with Plotly