
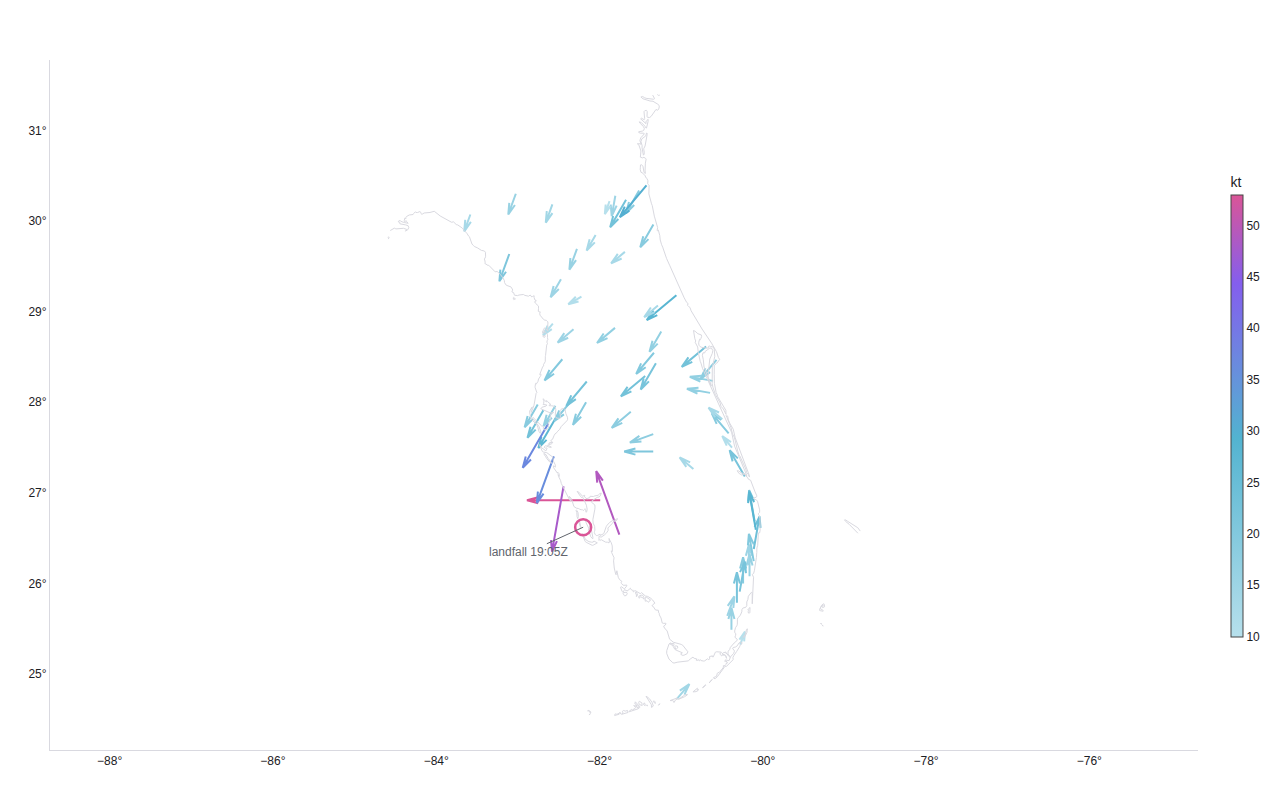
Hurricane Ian at landfall
Florida ASOS surface winds, 2022-09-28 19:00Z
Example from a field guide to quiver · shared helpers
Python Code
"""Hurricane Ian at landfall — Florida ASOS surface winds, 2022-09-28 19:00Z."""
from pathlib import Path

from _shared import fetch_csv, save, outline_trace, themed_layout, SPEED_SCALE, PINK, MUTED

import numpy as np

CHART_NUM = 3

# Every Florida ASOS station in the half hour around landfall at Cayo Costa
# (~19:05Z). The cyclonic rotation is visible in raw airport observations.
URL = (
    "https://mesonet.agron.iastate.edu/cgi-bin/request/asos.py"
    "?network=FL_ASOS&data=drct&data=sknt&data=gust"
    "&year1=2022&month1=9&day1=28&hour1=18&minute1=40"
    "&year2=2022&month2=9&day2=28&hour2=19&minute2=10"
    "&tz=Etc/UTC&format=onlycomma&missing=M&trace=T&latlon=yes"
)
BBOX = (-83.6, 24.6, -79.8, 30.4)
LANDFALL = (-82.2, 26.62)  # Cayo Costa, ~19:05Z (NHC)


def generate():
    print("fetching FL_ASOS around Ian's landfall …")
    df = fetch_csv(URL, na_values=["M", "T"])
    df = df.dropna(subset=["drct", "sknt", "lat", "lon"])
    df = df[df["sknt"] > 0]
    # Latest report per station within the window
    df = df.sort_values("valid").groupby("station").last().reset_index()
    df = df[df["lon"].between(BBOX[0], BBOX[2]) & df["lat"].between(BBOX[1], BBOX[3])]
    print(f"  {len(df)} stations reporting")

    theta = np.deg2rad(df["drct"])
    u = (-df["sknt"] * np.sin(theta)).tolist()
    v = (-df["sknt"] * np.cos(theta)).tolist()
    gust = [
        "" if np.isnan(g) else f" · gust {g:.0f} kt" for g in df["gust"]
    ]

    arrows = {
        "type": "quiver",
        "x": df["lon"].tolist(),
        "y": df["lat"].tolist(),
        "u": u,
        "v": v,
        "arrowref": "paper",
        "lengthmode": "scaled",
        "lengthfactor": 1.35,
        "marker": {
            "colorscale": SPEED_SCALE,
            "showscale": True,
            "colorbar": {"title": {"text": "kt"}, "thickness": 12, "len": 0.7},
            "line": {"width": 2},
        },
        "customdata": [
            f"{sid} · {spd:.0f} kt{g}"
            for sid, spd, g in zip(df["station"], df["sknt"], gust)
        ],
        "hovertemplate": "%{customdata}<extra></extra>",
        "showlegend": False,
    }
    eye = {
        "type": "scatter",
        "x": [LANDFALL[0]],
        "y": [LANDFALL[1]],
        "mode": "markers",
        "marker": {"symbol": "circle-open", "size": 16, "color": PINK,
                   "line": {"width": 2.5}},
        "hovertemplate": "landfall ~19:05Z · Cayo Costa<extra></extra>",
        "showlegend": False,
    }
    coast = outline_trace(
        "coastline", bbox=(BBOX[0] - 1, BBOX[1] - 1, BBOX[2] + 1, BBOX[3] + 1),
        res="10m",
    )

    layout = themed_layout(
        xaxis={"ticksuffix": "°", "showgrid": False, "zeroline": False},
        yaxis={
            "ticksuffix": "°",
            "showgrid": False,
            "zeroline": False,
            "scaleanchor": "x",
            "scaleratio": 1.11,  # ~1/cos(27°)
        },
        annotations=[
            {
                "x": LANDFALL[0], "y": LANDFALL[1], "text": "landfall 19:05Z",
                "showarrow": True, "arrowcolor": MUTED, "arrowwidth": 1,
                "arrowhead": 0, "ax": -55, "ay": 25,
                "font": {"color": MUTED, "size": 12},
            }
        ],
    )
    save(CHART_NUM, {"data": [coast, arrows, eye], "layout": layout})
Made with Plotly