
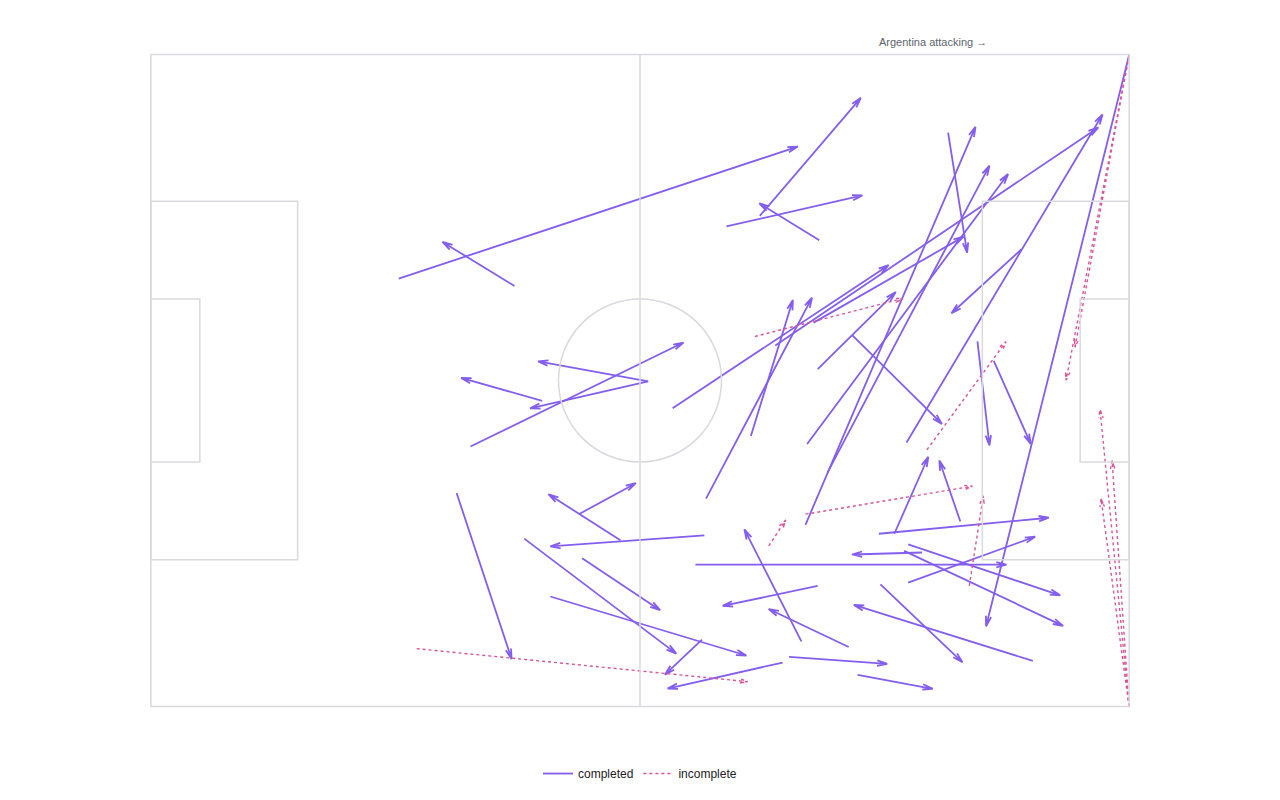
Every Messi pass in the 2022 World Cup final
StatsBomb Open Data
Example from a field guide to quiver · shared helpers
Python Code
"""Every Messi pass in the 2022 World Cup final — StatsBomb Open Data."""
from pathlib import Path

from _shared import fetch_json, save, themed_layout, GRID, MUTED, VIOLET, PINK

CHART_NUM = 9

# Argentina 3(4)–3(2) France, 2022-12-18. Match 3869685 in StatsBomb Open Data.
URL = "https://raw.githubusercontent.com/statsbomb/open-data/master/data/events/3869685.json"
PLAYER = "Lionel Andrés Messi Cuccittini"


def pitch_shapes():
    """A 120×80 StatsBomb pitch drawn with layout shapes."""
    line = {"color": GRID, "width": 1.5}
    shapes = [
        {"type": "rect", "x0": 0, "y0": 0, "x1": 120, "y1": 80, "line": line},
        {"type": "line", "x0": 60, "y0": 0, "x1": 60, "y1": 80, "line": line},
        {"type": "circle", "x0": 50, "y0": 30, "x1": 70, "y1": 50, "line": line},
        # Penalty areas + six-yard boxes (StatsBomb: 18 yd deep, 44 yd wide)
        {"type": "rect", "x0": 0, "y0": 18, "x1": 18, "y1": 62, "line": line},
        {"type": "rect", "x0": 102, "y0": 18, "x1": 120, "y1": 62, "line": line},
        {"type": "rect", "x0": 0, "y0": 30, "x1": 6, "y1": 50, "line": line},
        {"type": "rect", "x0": 114, "y0": 30, "x1": 120, "y1": 50, "line": line},
    ]
    return shapes


def generate():
    print("fetching the 2022 World Cup final …")
    events = fetch_json(URL)
    passes = [
        e for e in events
        if e["type"]["name"] == "Pass" and e["player"]["name"] == PLAYER
    ]
    print(f"  {len(passes)} Messi passes")

    def rows(complete: bool):
        out = []
        for e in passes:
            failed = "outcome" in e["pass"]
            if failed == complete:
                continue
            x0, y0 = e["location"]
            x1, y1 = e["pass"]["end_location"]
            to = e["pass"].get("recipient", {}).get("name", "—").split()[-1]
            label = f"{e['minute']}′ → {to}" if complete else f"{e['minute']}′ incomplete"
            out.append((x0, y0, x1 - x0, y1 - y0, label))
        return out

    traces = []
    for name, complete, color, dash, width in [
        ("completed", True, VIOLET, "solid", 1.8),
        ("incomplete", False, PINK, "dot", 1.4),
    ]:
        rs = rows(complete)
        traces.append({
            "type": "quiver",
            "name": name,
            "x": [r[0] for r in rs],
            "y": [r[1] for r in rs],
            "u": [r[2] for r in rs],
            "v": [r[3] for r in rs],
            # raw + data: every arrow lands exactly where the ball did
            "arrowref": "data",
            "lengthmode": "raw",
            "marker": {"color": color, "line": {"width": width, "dash": dash}},
            "customdata": [r[4] for r in rs],
            "hovertemplate": "%{customdata}<extra></extra>",
        })

    layout = themed_layout(
        xaxis={"visible": False, "range": [-3, 123]},
        yaxis={"visible": False, "range": [83, -3],  # StatsBomb y grows downward
               "scaleanchor": "x"},
        shapes=pitch_shapes(),
        legend={"x": 0.5, "y": -0.04, "xanchor": "center", "orientation": "h"},
        annotations=[
            {"x": 96, "y": -1.5, "text": "Argentina attacking →",
             "showarrow": False, "font": {"color": MUTED, "size": 11}},
        ],
        margin={"t": 30, "b": 30, "l": 30, "r": 30},
    )
    save(CHART_NUM, {"data": traces, "layout": layout})
Made with Plotly