
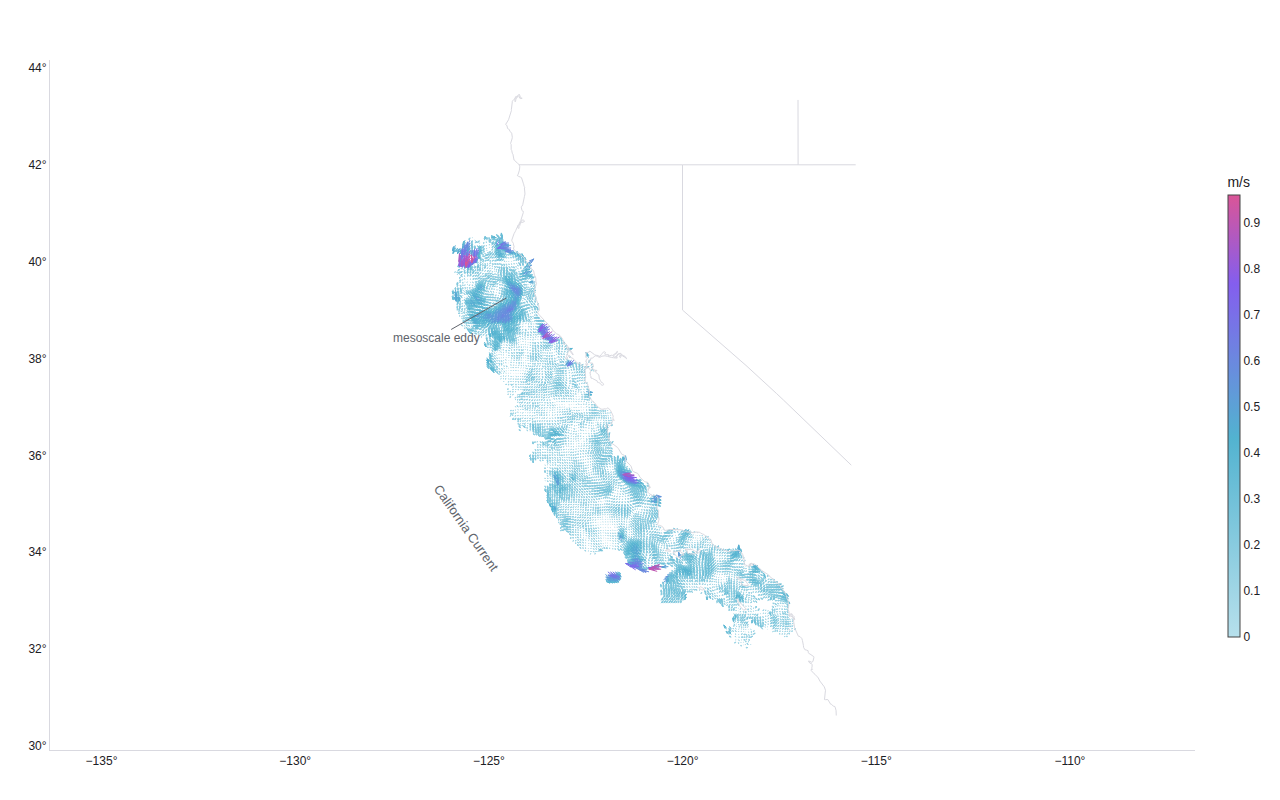
Ocean surface currents
NOAA HFRNet coastal HF radar, 6 km, US West Coast
Example from a field guide to quiver · shared helpers
Python Code
"""Ocean surface currents — NOAA HFRNet coastal HF radar, 6 km, US West Coast."""
from pathlib import Path

from _shared import fetch_csv, save, outline_trace, themed_layout, SPEED_SCALE, MUTED

import numpy as np

CHART_NUM = 1

# One hour of the national HF-radar surface-current mosaic. Every arrow is a
# real over-the-horizon radar measurement of the sea surface, not a model.
TIME = "2026-08-13T21:00:00Z"
BBOX = (-126.5, 31.5, -116.5, 42.5)  # San Diego → Cape Mendocino
URL = (
    "https://coastwatch.pfeg.noaa.gov/erddap/griddap/ucsdHfrW6.csv"
    f"?water_u[({TIME})][({BBOX[1]}):({BBOX[3]})][({BBOX[0]}):({BBOX[2]})]"
    f",water_v[({TIME})][({BBOX[1]}):({BBOX[3]})][({BBOX[0]}):({BBOX[2]})]"
)


def generate():
    print("fetching HFRNet surface currents …")
    df = fetch_csv(URL, skiprows=[1])  # row 1 is the units row
    df = df.dropna(subset=["water_u", "water_v"])
    speed = np.hypot(df["water_u"], df["water_v"])
    print(f"  {len(df)} radar cells, max {speed.max():.2f} m/s")

    arrows = {
        "type": "quiver",
        "name": "surface current",
        "x": df["longitude"].tolist(),
        "y": df["latitude"].tolist(),
        "u": df["water_u"].tolist(),
        "v": df["water_v"].tolist(),
        "arrowref": "paper",
        "lengthmode": "scaled",
        "lengthfactor": 2.6,
        "marker": {
            "colorscale": SPEED_SCALE,
            "showscale": True,
            "colorbar": {"title": {"text": "m/s"}, "thickness": 12, "len": 0.7},
            "line": {"width": 1},
        },
        "customdata": [f"{s:.2f} m/s" for s in speed],
        "hovertemplate": "%{customdata}<br>u %{u:.2f} · v %{v:.2f}<extra></extra>",
        "showlegend": False,
    }
    coast = outline_trace(
        "coastline", bbox=(BBOX[0] - 1, BBOX[1] - 1, BBOX[2] + 1, BBOX[3] + 1),
        res="10m",
    )
    states = outline_trace(
        "states", bbox=(BBOX[0] - 1, BBOX[1] - 1, BBOX[2] + 1, BBOX[3] + 1)
    )

    layout = themed_layout(
        xaxis={"ticksuffix": "°", "showgrid": False, "zeroline": False,
               "range": [-127.3, -115.8]},
        yaxis={
            "ticksuffix": "°",
            "showgrid": False,
            "zeroline": False,
            "scaleanchor": "x",
            "scaleratio": 1.25,  # ~1/cos(37°): keep the coastline's shape
        },
        annotations=[
            {
                "x": -125.6, "y": 34.5, "text": "California Current",
                "showarrow": False, "textangle": 55,
                "font": {"color": MUTED, "size": 13},
            },
            {
                "x": -124.55, "y": 39.25, "text": "mesoscale eddy",
                "showarrow": True, "arrowcolor": MUTED, "arrowwidth": 1,
                "arrowhead": 0, "ax": -70, "ay": 40,
                "font": {"color": MUTED, "size": 12},
            },
        ],
    )
    save(CHART_NUM, {"data": [coast, states, arrows], "layout": layout})
Made with Plotly