
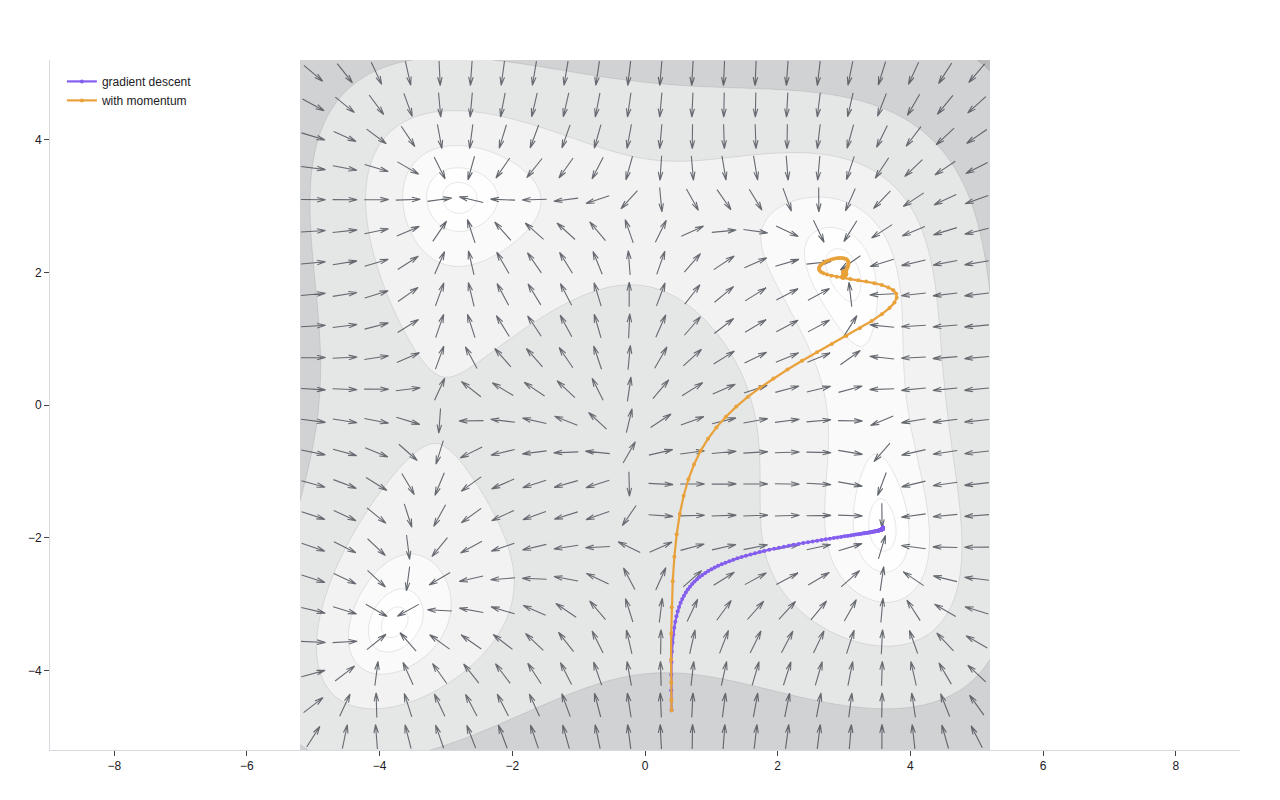
Gradient descent vs. momentum
the force field optimizers feel, on Himmelblau's surface
Example from a field guide to quiver · shared helpers
Python Code
"""Gradient descent vs. momentum — the force field optimizers feel, on Himmelblau's surface."""
from pathlib import Path

from _shared import save, themed_layout, VIOLET, ORANGE, MUTED

import numpy as np

CHART_NUM = 7

LIM = 5.2


def f(x, y):
    return (x**2 + y - 11) ** 2 + (x + y**2 - 7) ** 2


def grad(x, y):
    dx = 4 * x * (x**2 + y - 11) + 2 * (x + y**2 - 7)
    dy = 2 * (x**2 + y - 11) + 4 * y * (x + y**2 - 7)
    return dx, dy


def generate():
    # The surface, as a contour of log-loss
    gx = np.linspace(-LIM, LIM, 120)
    gy = np.linspace(-LIM, LIM, 120)
    GX, GY = np.meshgrid(gx, gy)
    contour = {
        "type": "contour",
        "x": gx.tolist(),
        "y": gy.tolist(),
        "z": np.log10(f(GX, GY) + 1).tolist(),
        "colorscale": [[0, "rgba(255,255,255,0)"], [1, "rgba(28,32,36,0.14)"]],
        "contours": {"coloring": "fill", "showlines": True},
        "line": {"color": "rgba(28,32,36,0.10)", "width": 1},
        "showscale": False,
        "hoverinfo": "skip",
    }

    # The force an optimizer feels: −∇f, drawn as a direction field
    ax = np.linspace(-LIM + 0.2, LIM - 0.2, 22)
    ay = np.linspace(-LIM + 0.2, LIM - 0.2, 22)
    AX, AY = [a.ravel() for a in np.meshgrid(ax, ay)]
    dx, dy = grad(AX, AY)
    mag = np.hypot(dx, dy) + 1e-9
    arrows = {
        "type": "quiver",
        "x": AX.tolist(),
        "y": AY.tolist(),
        "u": (-dx / mag).tolist(),
        "v": (-dy / mag).tolist(),
        "arrowref": "paper",
        "lengthmode": "scaled",
        "lengthfactor": 0.8,
        "anchor": "center",
        "marker": {"color": MUTED, "line": {"width": 1.1}},
        "hoverinfo": "skip",
        "showlegend": False,
    }

    # Two optimizers, same start, same surface
    def descend(lr, beta, steps=220):
        x, y = 0.4, -4.6
        vx = vy = 0.0
        path = [(x, y)]
        for _ in range(steps):
            dx, dy = grad(x, y)
            vx = beta * vx - lr * dx
            vy = beta * vy - lr * dy
            x, y = x + vx, y + vy
            path.append((x, y))
        return path

    paths = [
        ("gradient descent", descend(lr=0.001, beta=0.0), VIOLET),
        ("with momentum", descend(lr=0.0005, beta=0.90), ORANGE),
    ]
    path_traces = []
    for name, path, color in paths:
        px, py = zip(*path)
        path_traces.append({
            "type": "scatter",
            "name": name,
            "x": px,
            "y": py,
            "mode": "lines+markers",
            "line": {"color": color, "width": 2.2},
            "marker": {"size": 4, "color": color},
            "hovertemplate": name + " · (%{x:.2f}, %{y:.2f})<extra></extra>",
        })

    layout = themed_layout(
        xaxis={"showgrid": False, "zeroline": False, "range": [-LIM, LIM]},
        yaxis={"showgrid": False, "zeroline": False, "range": [-LIM, LIM],
               "scaleanchor": "x"},
        legend={"x": 0.01, "y": 0.99, "bgcolor": "rgba(255,255,255,0.8)"},
    )
    save(CHART_NUM, {"data": [contour, arrows] + path_traces, "layout": layout})
Made with Plotly