
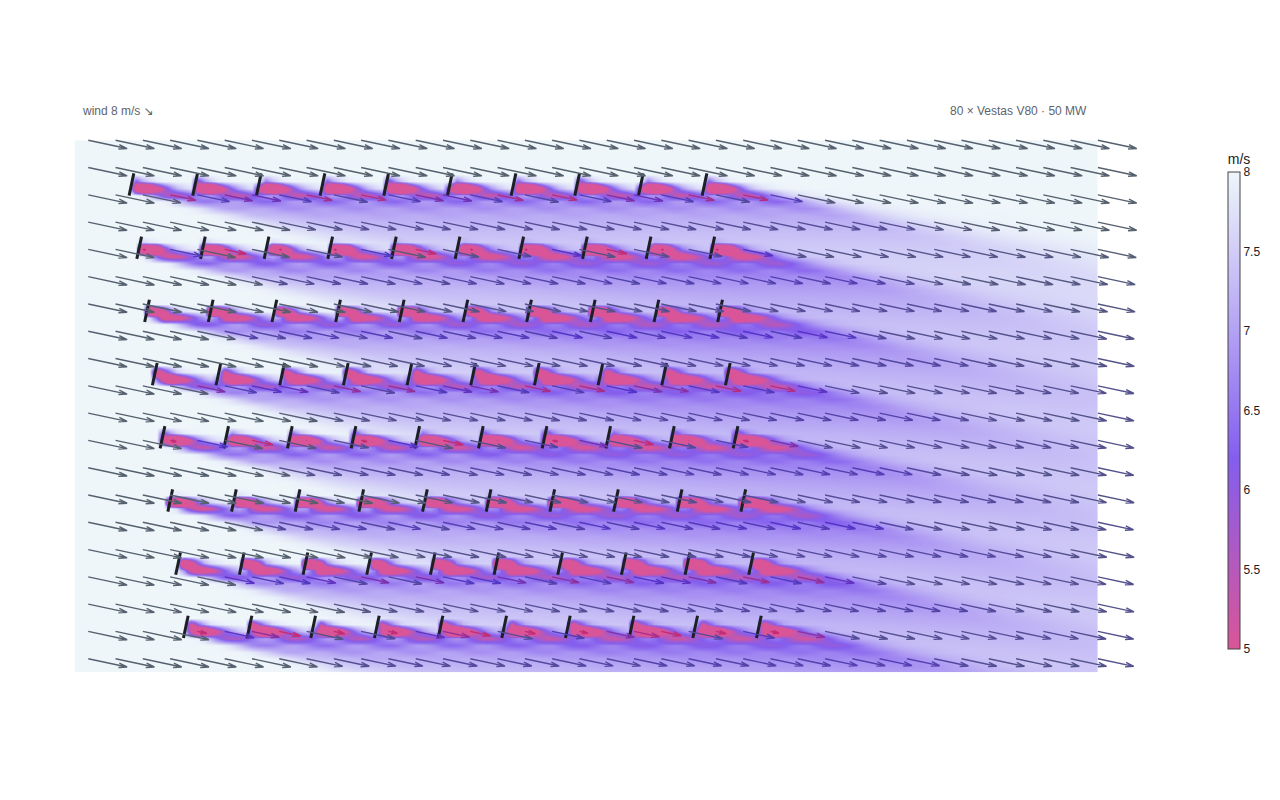
Wind farm wakes
PyWake's Bastankhah–Porté-Agel model over Horns Rev 1, 80 turbines
Example from a field guide to quiver · shared helpers
Python Code
"""Wind farm wakes — PyWake's Bastankhah–Porté-Agel model over Horns Rev 1, 80 turbines."""
import warnings
from pathlib import Path

from _shared import save, themed_layout, TEXT, MUTED, VIOLET, PINK

import numpy as np

warnings.filterwarnings("ignore")
from py_wake.examples.data.hornsrev1 import Hornsrev1Site, V80, wt_x, wt_y
from py_wake.flow_map import XYGrid
from py_wake.literature.gaussian_models import Bastankhah_PorteAgel_2014

CHART_NUM = 11

WD = 282.0   # wind from WNW, so the wakes trail down-right across the rows
WS = 8.0     # m/s


def generate():
    print("running PyWake on Horns Rev 1 …")
    x = np.array(wt_x) - min(wt_x)
    y = np.array(wt_y) - min(wt_y)
    site, turbine = Hornsrev1Site(), V80()
    wfm = Bastankhah_PorteAgel_2014(site, turbine, k=0.0324555)
    sim = wfm(x, y, wd=WD, ws=WS)
    power_mw = np.asarray(sim.Power).squeeze() / 1e6
    print(f"  {len(x)} turbines · farm output {power_mw.sum():.1f} MW")

    # Effective wind speed on a dense grid, straight from the model
    gx = np.arange(-500, x.max() + 3000, 60.0)
    gy = np.arange(-400, y.max() + 400, 60.0)
    fm = sim.flow_map(XYGrid(x=gx, y=gy))
    ws_eff = np.asarray(fm.WS_eff).squeeze()          # shape (len(gy), len(gx))
    print(f"  flow map {ws_eff.shape} · slowest {ws_eff.min():.1f} m/s")

    # The wind-speed field as a smooth color underlay — the wakes read as
    # plumes, the way wake-model flow maps are usually drawn
    field = {
        "type": "contour",
        "x": (gx / 1000).tolist(),   # km, purely to keep the JSON small
        "y": (gy / 1000).tolist(),
        "z": ws_eff.tolist(),
        "contours": {"coloring": "heatmap", "showlines": False},
        "line": {"width": 0},
        "colorscale": [[0.0, PINK], [0.4, VIOLET], [1.0, "#eef6fa"]],
        # floor the color range in the far-wake regime: the handful of
        # near-rotor cells would otherwise wash out the streak contrast
        "zmin": 5.0,
        "zmax": WS,
        "colorbar": {"title": {"text": "m/s"}, "thickness": 12, "len": 0.7},
        "hovertemplate": "%{z:.1f} m/s<extra></extra>",
        "showlegend": False,
    }

    # Direction and speed on top: a sparser quiver, one arrow per 4th cell
    # met "from" direction → the flow vector points the opposite way
    theta = np.deg2rad(270 - WD)
    cosp, sinp = np.cos(theta), np.sin(theta)
    GX, GY = np.meshgrid(gx, gy)
    sub = np.zeros_like(GX, dtype=bool)
    sub[2::4, 2::4] = True
    arrows = {
        "type": "quiver",
        "x": (GX[sub] / 1000).tolist(),
        "y": (GY[sub] / 1000).tolist(),
        "u": (ws_eff[sub] * cosp).tolist(),
        "v": (ws_eff[sub] * sinp).tolist(),
        # the rc draws the quiver layer beneath contour fills; an overlaying
        # axis pair lifts the arrows above the field
        "xaxis": "x2",
        "yaxis": "y2",
        "arrowref": "paper",
        "lengthmode": "scaled",
        "lengthfactor": 1.5,
        # colorscale with no color array → arrows color by |(u,v)| = wind speed;
        # a darker ramp than the field underlay so the arrows stay legible
        "marker": {
            "colorscale": [[0.0, "#c22d76"], [0.4, "#5233c9"], [1.0, "#55616e"]],
            "cmin": 5.0,
            "cmax": WS,
            "showscale": False,
            "line": {"width": 1.4},
        },
        "customdata": [f"{s:.1f} m/s" for s in ws_eff[sub]],
        "hovertemplate": "%{customdata}<extra></extra>",
        "showlegend": False,
    }

    # Each turbine drawn as its rotor: a line perpendicular to the wind,
    # exaggerated ~2.5x rotor scale so the machines read at farm scale
    half = 1.25 * 80.0
    rx, ry = [], []
    for xt, yt in zip(x, y):
        rx += [(xt - half * -sinp) / 1000, (xt + half * -sinp) / 1000, None]
        ry += [(yt - half * cosp) / 1000, (yt + half * cosp) / 1000, None]
    rotors = {
        "type": "scatter",
        "x": rx,
        "y": ry,
        "mode": "lines",
        "line": {"color": TEXT, "width": 3},
        "hoverinfo": "skip",
        "showlegend": False,
    }
    # Invisible markers at the hubs carry the per-turbine power on hover
    hubs = {
        "type": "scatter",
        "x": (x / 1000).tolist(),
        "y": (y / 1000).tolist(),
        "mode": "markers",
        "marker": {"size": 14, "opacity": 0},
        "customdata": [
            f"turbine {i + 1} · {p:.2f} MW" for i, p in enumerate(power_mw)
        ],
        "hovertemplate": "%{customdata}<extra></extra>",
        "showlegend": False,
    }

    layout = themed_layout(
        xaxis={"visible": False},
        yaxis={"visible": False, "scaleanchor": "x"},
        xaxis2={"overlaying": "x", "matches": "x", "visible": False},
        yaxis2={"overlaying": "y", "matches": "y", "visible": False},
        annotations=[
            {"x": -0.45, "y": (y.max() + 650) / 1000, "text": "wind 8 m/s ↘",
             "showarrow": False, "font": {"color": MUTED, "size": 12},
             "xanchor": "left"},
            {"x": (x.max() + 2900) / 1000, "y": (y.max() + 650) / 1000,
             "text": f"80 × Vestas V80 · {power_mw.sum():.0f} MW",
             "showarrow": False, "font": {"color": MUTED, "size": 12},
             "xanchor": "right"},
        ],
        margin={"t": 30, "b": 30, "l": 30, "r": 30},
    )
    save(CHART_NUM, {"data": [field, arrows, rotors, hubs], "layout": layout})
Made with Plotly