
The electric dipole field
Coulomb's law, drawn as a direction field
Example from a field guide to quiver · shared helpers
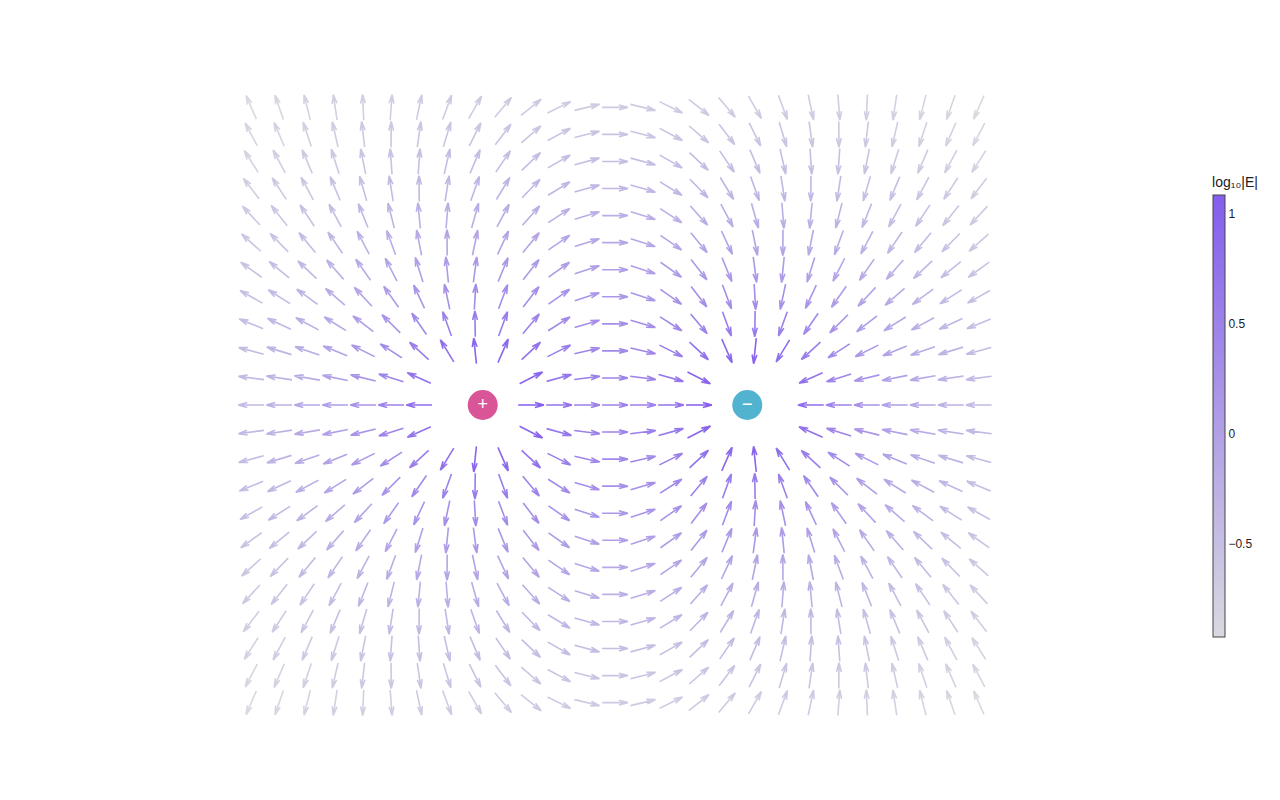
Python Code
"""The electric dipole field — Coulomb's law, drawn as a direction field."""
from pathlib import Path

from _shared import save, themed_layout, GREY_VIOLET_SCALE, PINK, TEAL

import numpy as np

CHART_NUM = 5

Q = [(-0.8, 0.0, +1.0), (0.8, 0.0, -1.0)]  # (x, y, charge)


def generate():
    xs = np.linspace(-2.2, 2.2, 27)
    ys = np.linspace(-1.8, 1.8, 23)
    X, Y = [a.ravel() for a in np.meshgrid(xs, ys)]

    Ex = np.zeros_like(X)
    Ey = np.zeros_like(Y)
    near = np.zeros_like(X, dtype=bool)
    for qx, qy, q in Q:
        dx, dy = X - qx, Y - qy
        r2 = dx * dx + dy * dy
        r = np.sqrt(r2)
        near |= r < 0.28          # hide arrows sitting on top of a charge
        Ex += q * dx / (r2 * r)
        Ey += q * dy / (r2 * r)

    mag = np.hypot(Ex, Ey)
    keep = ~near
    X, Y, Ex, Ey, mag = X[keep], Y[keep], Ex[keep], Ey[keep], mag[keep]

    # Direction field: every arrow unit length, color carries the magnitude.
    arrows = {
        "type": "quiver",
        "x": X.tolist(),
        "y": Y.tolist(),
        "u": (Ex / mag).tolist(),
        "v": (Ey / mag).tolist(),
        "arrowref": "paper",
        "lengthmode": "scaled",
        "lengthfactor": 0.95,
        "anchor": "center",
        "marker": {
            "color": np.log10(mag).tolist(),
            "colorscale": GREY_VIOLET_SCALE,
            "showscale": True,
            "colorbar": {"title": {"text": "log₁₀|E|"}, "thickness": 12, "len": 0.7},
            "line": {"width": 1.6},
        },
        "customdata": [f"|E| = {m:.2f}" for m in mag],
        "hovertemplate": "%{customdata}<extra></extra>",
        "showlegend": False,
    }
    charges = {
        "type": "scatter",
        "x": [q[0] for q in Q],
        "y": [q[1] for q in Q],
        "mode": "markers+text",
        "marker": {"size": 30, "color": [PINK, TEAL]},
        "text": ["+", "−"],
        "textfont": {"color": "#ffffff", "size": 18},
        "textposition": "middle center",
        "hoverinfo": "skip",
        "showlegend": False,
    }

    layout = themed_layout(
        xaxis={"showgrid": False, "zeroline": False, "visible": False},
        yaxis={"showgrid": False, "zeroline": False, "visible": False,
               "scaleanchor": "x"},
    )
    save(CHART_NUM, {"data": [arrows, charges], "layout": layout})
Made with Plotly