
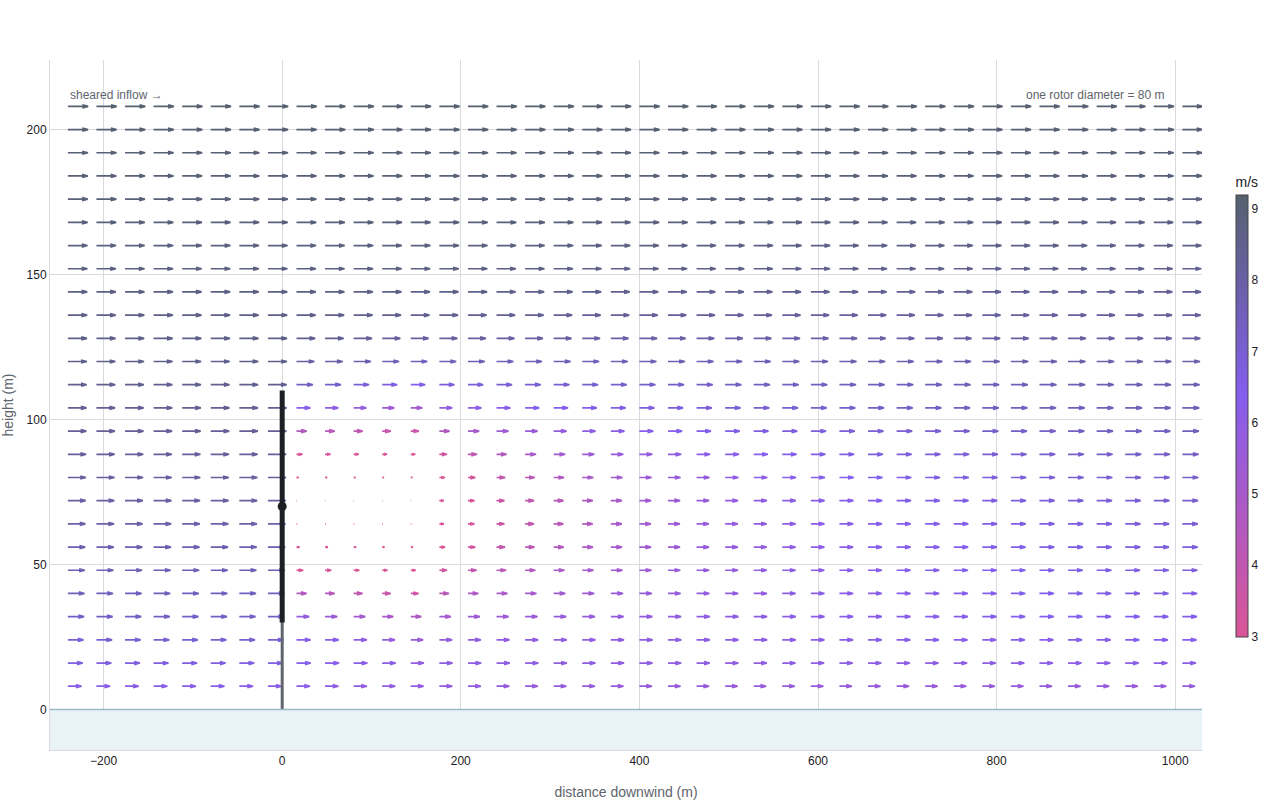
A single turbine's wake, from the side
PyWake vertical flow map through one V80
Example from a field guide to quiver · shared helpers
Python Code
"""A single turbine's wake, from the side — PyWake vertical flow map through one V80."""
import warnings
from pathlib import Path

from _shared import save, themed_layout, TEXT, MUTED, VIOLET, PINK

import numpy as np

warnings.filterwarnings("ignore")
from py_wake.examples.data.hornsrev1 import Hornsrev1Site, V80
from py_wake.flow_map import XZGrid
from py_wake.literature.gaussian_models import Bastankhah_PorteAgel_2014
from py_wake.site.shear import PowerShear

CHART_NUM = 16

WS = 8.0          # m/s at hub height
HUB = 70.0        # V80 hub height (m)
D = 80.0          # rotor diameter (m)


def generate():
    print("running PyWake, single V80, vertical slice …")
    # Power-law shear: the sea slows the wind near the surface
    site = Hornsrev1Site(shear=PowerShear(h_ref=HUB, alpha=0.12))
    wfm = Bastankhah_PorteAgel_2014(site, V80(), k=0.0324555)
    sim = wfm([0], [0], wd=270, ws=WS)

    # Effective wind speed on a vertical plane through the rotor axis
    gx = np.arange(-240, 1020, 32.0)      # downwind distance (m)
    gz = np.arange(8, 214, 8.0)           # height above the sea (m)
    fm = sim.flow_map(XZGrid(y=0, x=gx, z=gz))
    ws_eff = np.asarray(fm.WS_eff).squeeze()      # shape (len(gz), len(gx))
    print(f"  flow map {ws_eff.shape} · {ws_eff.min():.1f}–{ws_eff.max():.1f} m/s")

    GX, GZ = np.meshgrid(gx, gz)
    arrows = {
        "type": "quiver",
        "x": GX.ravel().tolist(),
        "y": GZ.ravel().tolist(),
        "u": ws_eff.ravel().tolist(),     # purely horizontal flow
        "v": np.zeros(ws_eff.size).tolist(),
        "arrowref": "paper",
        "lengthmode": "scaled",
        # keep the longest arrow well under the column spacing, so arrows
        # never run tip-to-tail and the lengths stay readable
        "lengthfactor": 0.8,
        # no color array → arrows color by |(u,v)|, i.e. the wind speed:
        # pink in the wake hole, violet mid-recovery, slate at full speed
        "marker": {
            "colorscale": [[0.0, PINK], [0.55, VIOLET], [1.0, "#55616e"]],
            "cmin": 3.0,
            "cmax": float(np.ceil(ws_eff.max() * 10) / 10),
            "showscale": True,
            "colorbar": {"title": {"text": "m/s"}, "thickness": 12, "len": 0.7},
            "arrowsize": 0.6,   # smaller heads, so the shaft carries the length
            "line": {"width": 1.7},
        },
        "customdata": [
            f"{s:.1f} m/s · {z:.0f} m up" for s, z in zip(ws_eff.ravel(), GZ.ravel())
        ],
        "hovertemplate": "%{customdata}<extra></extra>",
        "showlegend": False,
    }

    # The machine itself: tower, nacelle, and the rotor swept area
    tower = {
        "type": "scatter",
        "x": [0, 0], "y": [0, HUB],
        "mode": "lines",
        "line": {"color": MUTED, "width": 3},
        "hoverinfo": "skip", "showlegend": False,
    }
    rotor = {
        "type": "scatter",
        "x": [0, 0], "y": [HUB - D / 2, HUB + D / 2],
        "mode": "lines",
        "line": {"color": TEXT, "width": 5},
        "customdata": ["Vestas V80 · rotor 30–110 m"] * 2,
        "hovertemplate": "%{customdata}<extra></extra>",
        "showlegend": False,
    }
    nacelle = {
        "type": "scatter",
        "x": [0], "y": [HUB],
        "mode": "markers",
        "marker": {"color": TEXT, "size": 9},
        "hoverinfo": "skip", "showlegend": False,
    }

    layout = themed_layout(
        xaxis={
            "title": {"text": "distance downwind (m)", "font": {"color": MUTED}},
            "zeroline": False,
            "range": [-260, 1030],
        },
        yaxis={
            "title": {"text": "height (m)", "font": {"color": MUTED}},
            "zeroline": False,
            "range": [-14, 224],
        },
        shapes=[
            # the sea surface
            {"type": "rect", "x0": -260, "x1": 1030, "y0": -14, "y1": 0,
             "fillcolor": "#e8f2f7", "line": {"width": 0}},
            {"type": "line", "x0": -260, "x1": 1030, "y0": 0, "y1": 0,
             "line": {"color": "#9db8c8", "width": 1.5}},
        ],
        annotations=[
            {"x": -240, "y": 212, "text": "sheared inflow →",
             "showarrow": False, "font": {"color": MUTED, "size": 12},
             "xanchor": "left"},
            {"x": 990, "y": 212, "text": "one rotor diameter = 80 m",
             "showarrow": False, "font": {"color": MUTED, "size": 12},
             "xanchor": "right"},
        ],
    )
    save(CHART_NUM, {"data": [arrows, tower, rotor, nacelle], "layout": layout})
Made with Plotly