
Nightingale's rose
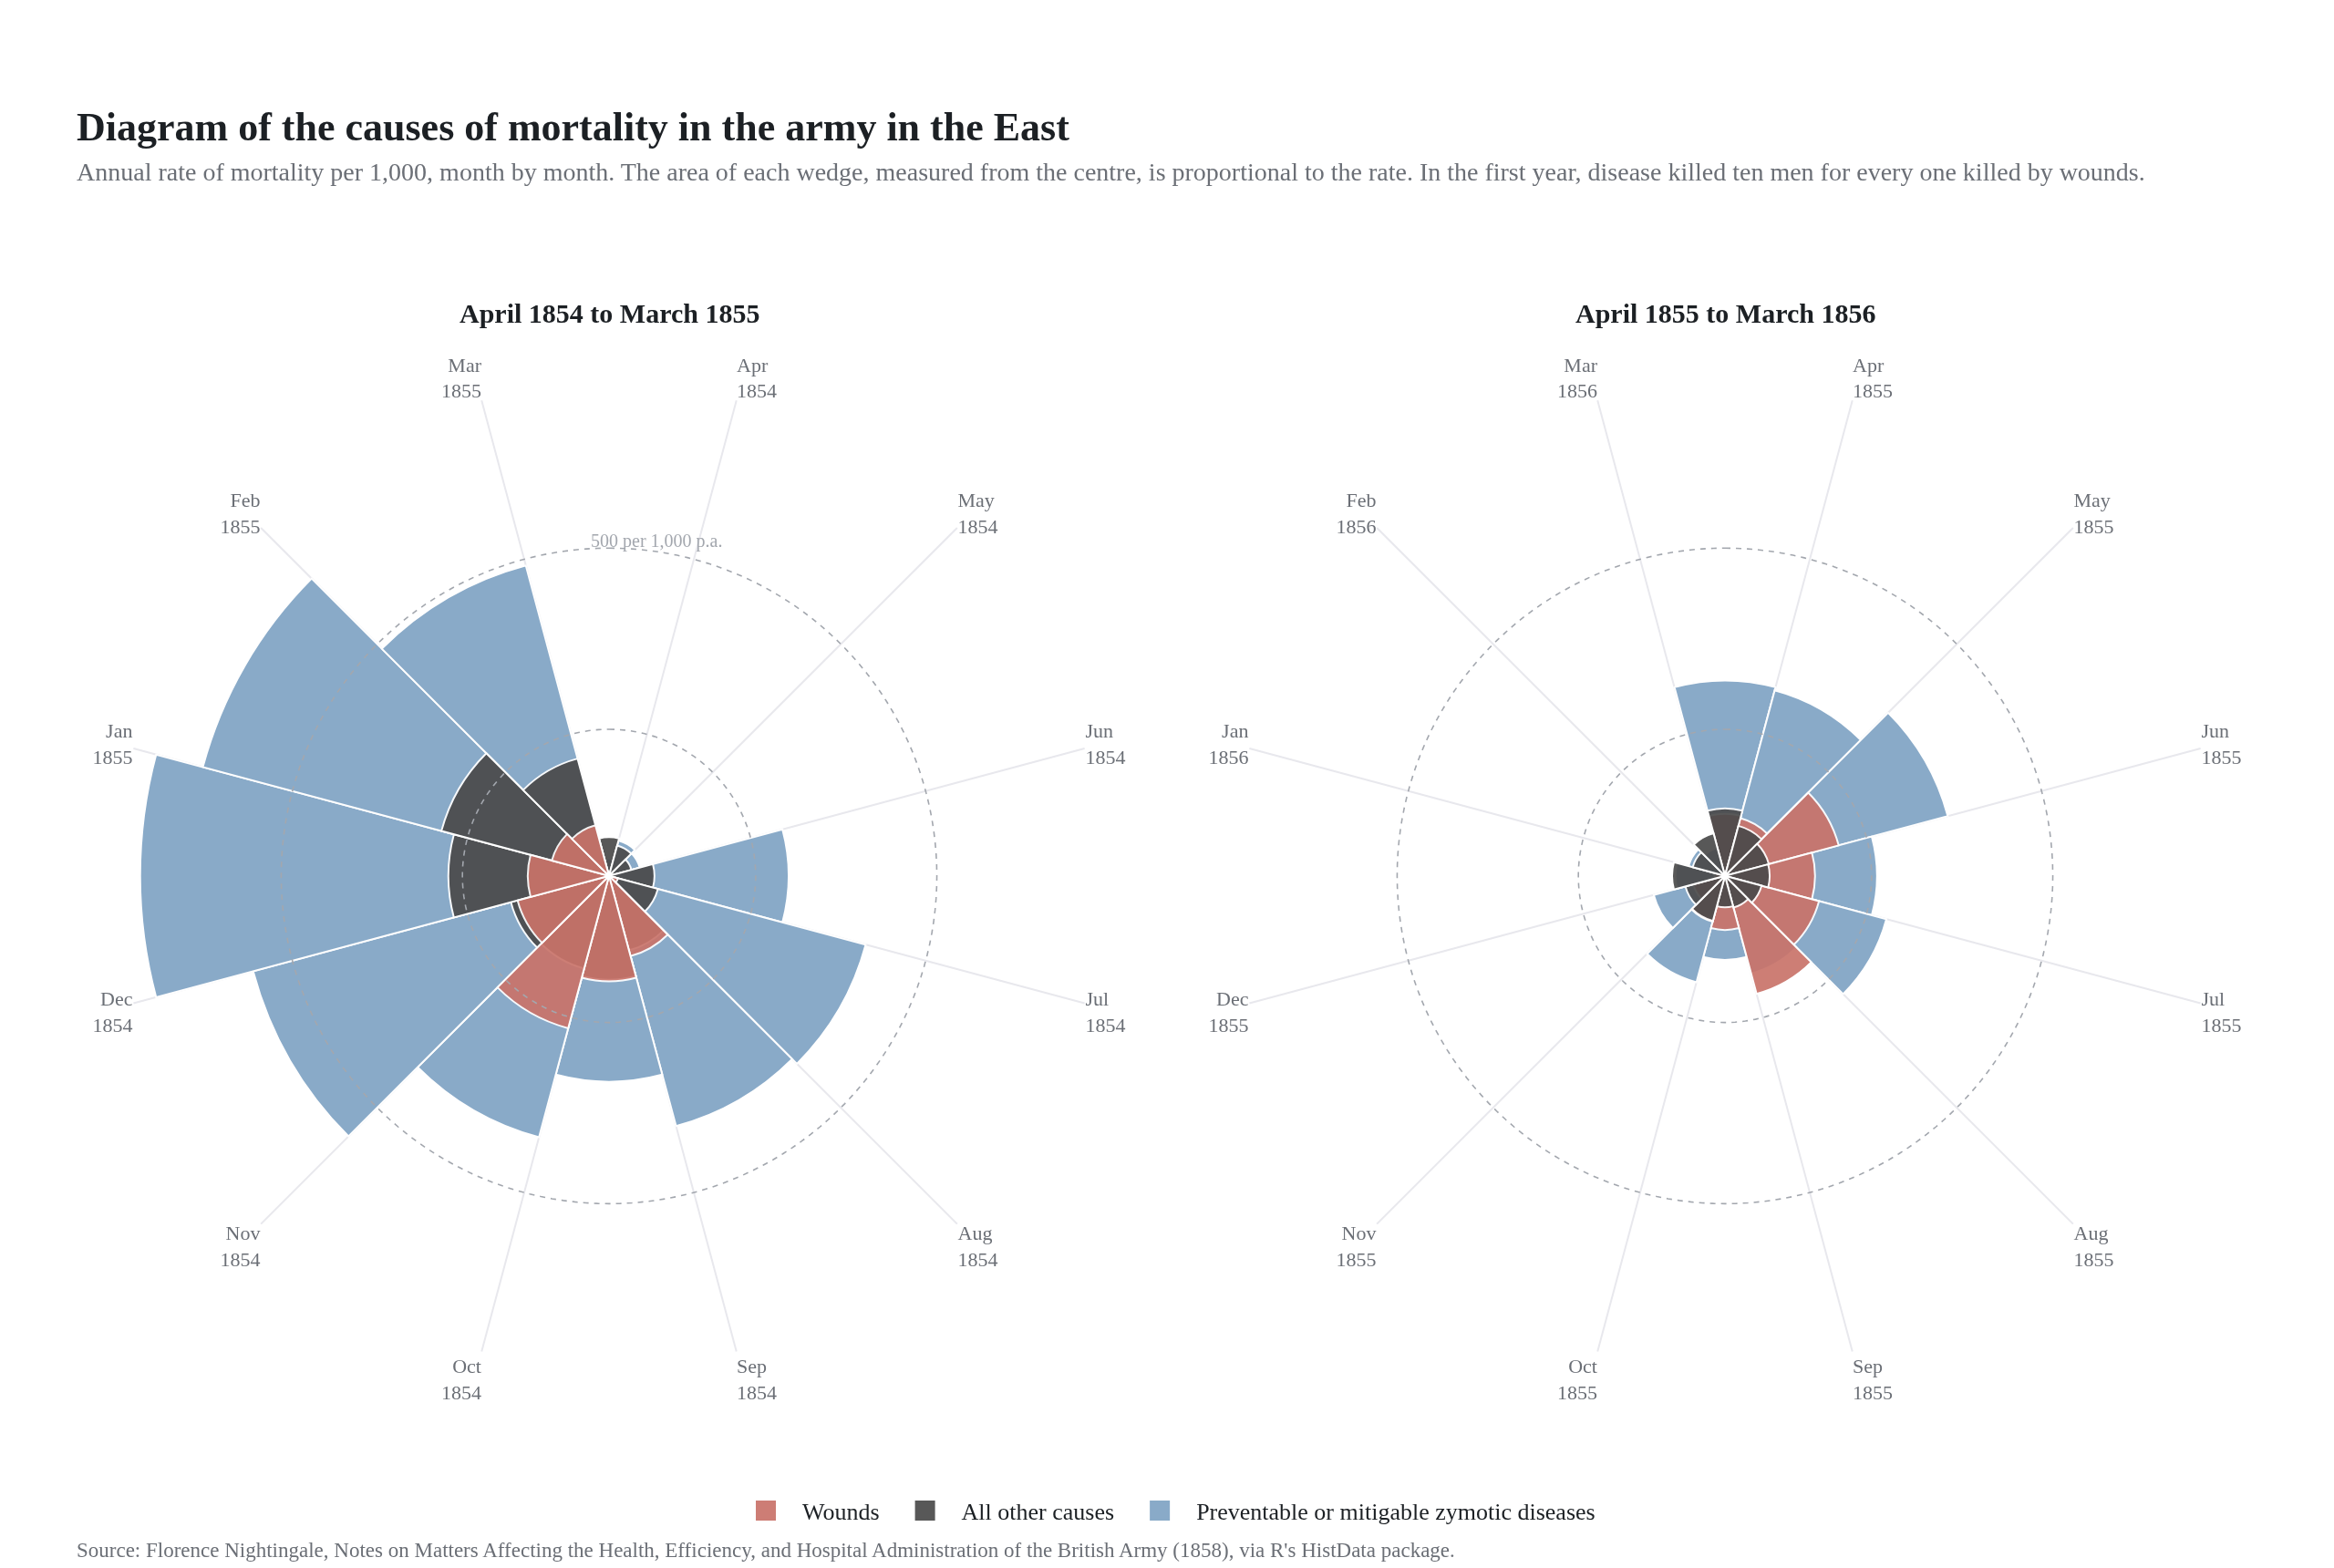
causes of death in the Crimean War, 1854–1856
Example from Plotly for highly customizable print-ready data visualization · shared helpers
Python Code
"""Nightingale's rose — causes of death in the Crimean War, 1854–1856.

Florence Nightingale's "coxcomb" (1858) as two polar panels: wedges drawn
from the centre, with area (not radius) proportional to the annual death
rate, in her own three colours. A polar chart with every default stripped
off and replaced by hand-placed labels.
"""
from pathlib import Path

from _shared import fetch_csv, save, base_layout, titles, INK, MUTED, FAINT, GRID, SERIF

import numpy as np
import pandas as pd
import plotly.graph_objects as go
from plotly.subplots import make_subplots

CHART_NUM = 9
URL = "https://vincentarelbundock.github.io/Rdatasets/csv/HistData/Nightingale.csv"
CAUSES = [("Disease.rate", "Preventable or mitigable zymotic diseases", "#7fa3c4"),
          ("Other.rate", "All other causes", "#4a4a4a"),
          ("Wounds.rate", "Wounds", "#c9736a")]


def generate():
    df = fetch_csv(URL)
    df["Date"] = pd.to_datetime(df["Date"])
    halves = [("April 1854 to March 1855", df[df["Date"] < "1855-04-01"]),
              ("April 1855 to March 1856", df[df["Date"] >= "1855-04-01"])]

    fig = make_subplots(rows=1, cols=2, specs=[[{"type": "polar"}] * 2], horizontal_spacing=0.06)
    rmax = np.sqrt(df[[c for c, _, _ in CAUSES]].to_numpy().max()) * 1.05
    for col, (label, part) in enumerate(halves, start=1):
        part = part.sort_values("Date")
        theta = np.arange(12) * 30
        # Largest wedge first so the smaller ones sit on top of it; radius = sqrt(rate) keeps area honest.
        for key, name, color in sorted(CAUSES, key=lambda c: -part[c[0]].sum()):
            fig.add_trace(go.Barpolar(
                r=np.sqrt(part[key].to_numpy()), theta=theta, width=30, base=0, name=name,
                marker=dict(color=color, line=dict(color="white", width=1)), opacity=0.92,
                hovertemplate="%{customdata}: %{text:.0f} per 1,000<extra>" + name + "</extra>",
                customdata=part["Month"] + " " + part["Year"].astype(str), text=part[key],
                showlegend=col == 1,
            ), row=1, col=col)
        fig.add_annotation(x=0.245 if col == 1 else 0.755, y=0.9, xref="paper", yref="paper", showarrow=False,
                           text=f"<b>{label}</b>", font=dict(size=15, color=INK, family=SERIF),
                           xanchor="center", yanchor="bottom", yshift=6)
        months = [f"{m[:3]}<br>{y}" for m, y in zip(part["Month"], part["Year"])]
        fig.layout[f"polar{'' if col == 1 else col}"].update(
            bgcolor="white", radialaxis=dict(visible=False, range=[0, rmax]),
            angularaxis=dict(direction="clockwise", rotation=90, tickmode="array", tickvals=theta + 15, ticktext=months,
                             showgrid=True, gridcolor=GRID, showline=False, ticks="",
                             tickfont=dict(size=11, color=MUTED, family=SERIF)),
            domain=dict(x=[0.02, 0.47] if col == 1 else [0.53, 0.98], y=[0.06, 0.88]),
        )
    # Area guide: a ring at 100 and 1,000 deaths per 1,000 per annum (sqrt scale).
    for col in (1, 2):
        for lvl in (100, 500):
            fig.add_trace(go.Scatterpolar(r=[np.sqrt(lvl)] * 181, theta=np.linspace(0, 360, 181), mode="lines",
                                          line=dict(color=FAINT, width=0.8, dash="dot"), hoverinfo="skip", showlegend=False), row=1, col=col)
    fig.add_annotation(x=0.235, y=0.06 + 0.82 * 0.5 + 0.41 * np.sqrt(500) / rmax, xref="paper", yref="paper",
                       text="500 per 1,000 p.a.", showarrow=False, font=dict(size=10, color=FAINT, family=SERIF), yshift=6)

    fig.update_layout(**base_layout(font=dict(family=SERIF, size=13, color=INK), margin=dict(l=40, r=40, t=120, b=60),
                                    showlegend=True,
                                    legend=dict(orientation="h", x=0.5, xanchor="center", y=-0.02, yanchor="top",
                                                font=dict(size=13, family=SERIF), itemwidth=30, traceorder="reversed")))
    titles(fig, "Diagram of the causes of mortality in the army in the East",
           "Annual rate of mortality per 1,000, month by month. The area of each wedge, measured from the centre, is proportional to the rate. "
           "In the first year, disease killed ten men for every one killed by wounds.",
           "Source: Florence Nightingale, Notes on Matters Affecting the Health, Efficiency, and Hospital Administration of the British Army (1858), via R's HistData package.",
           lift=6)
    save(CHART_NUM, fig, width=1280, height=860)
Made with Plotly