
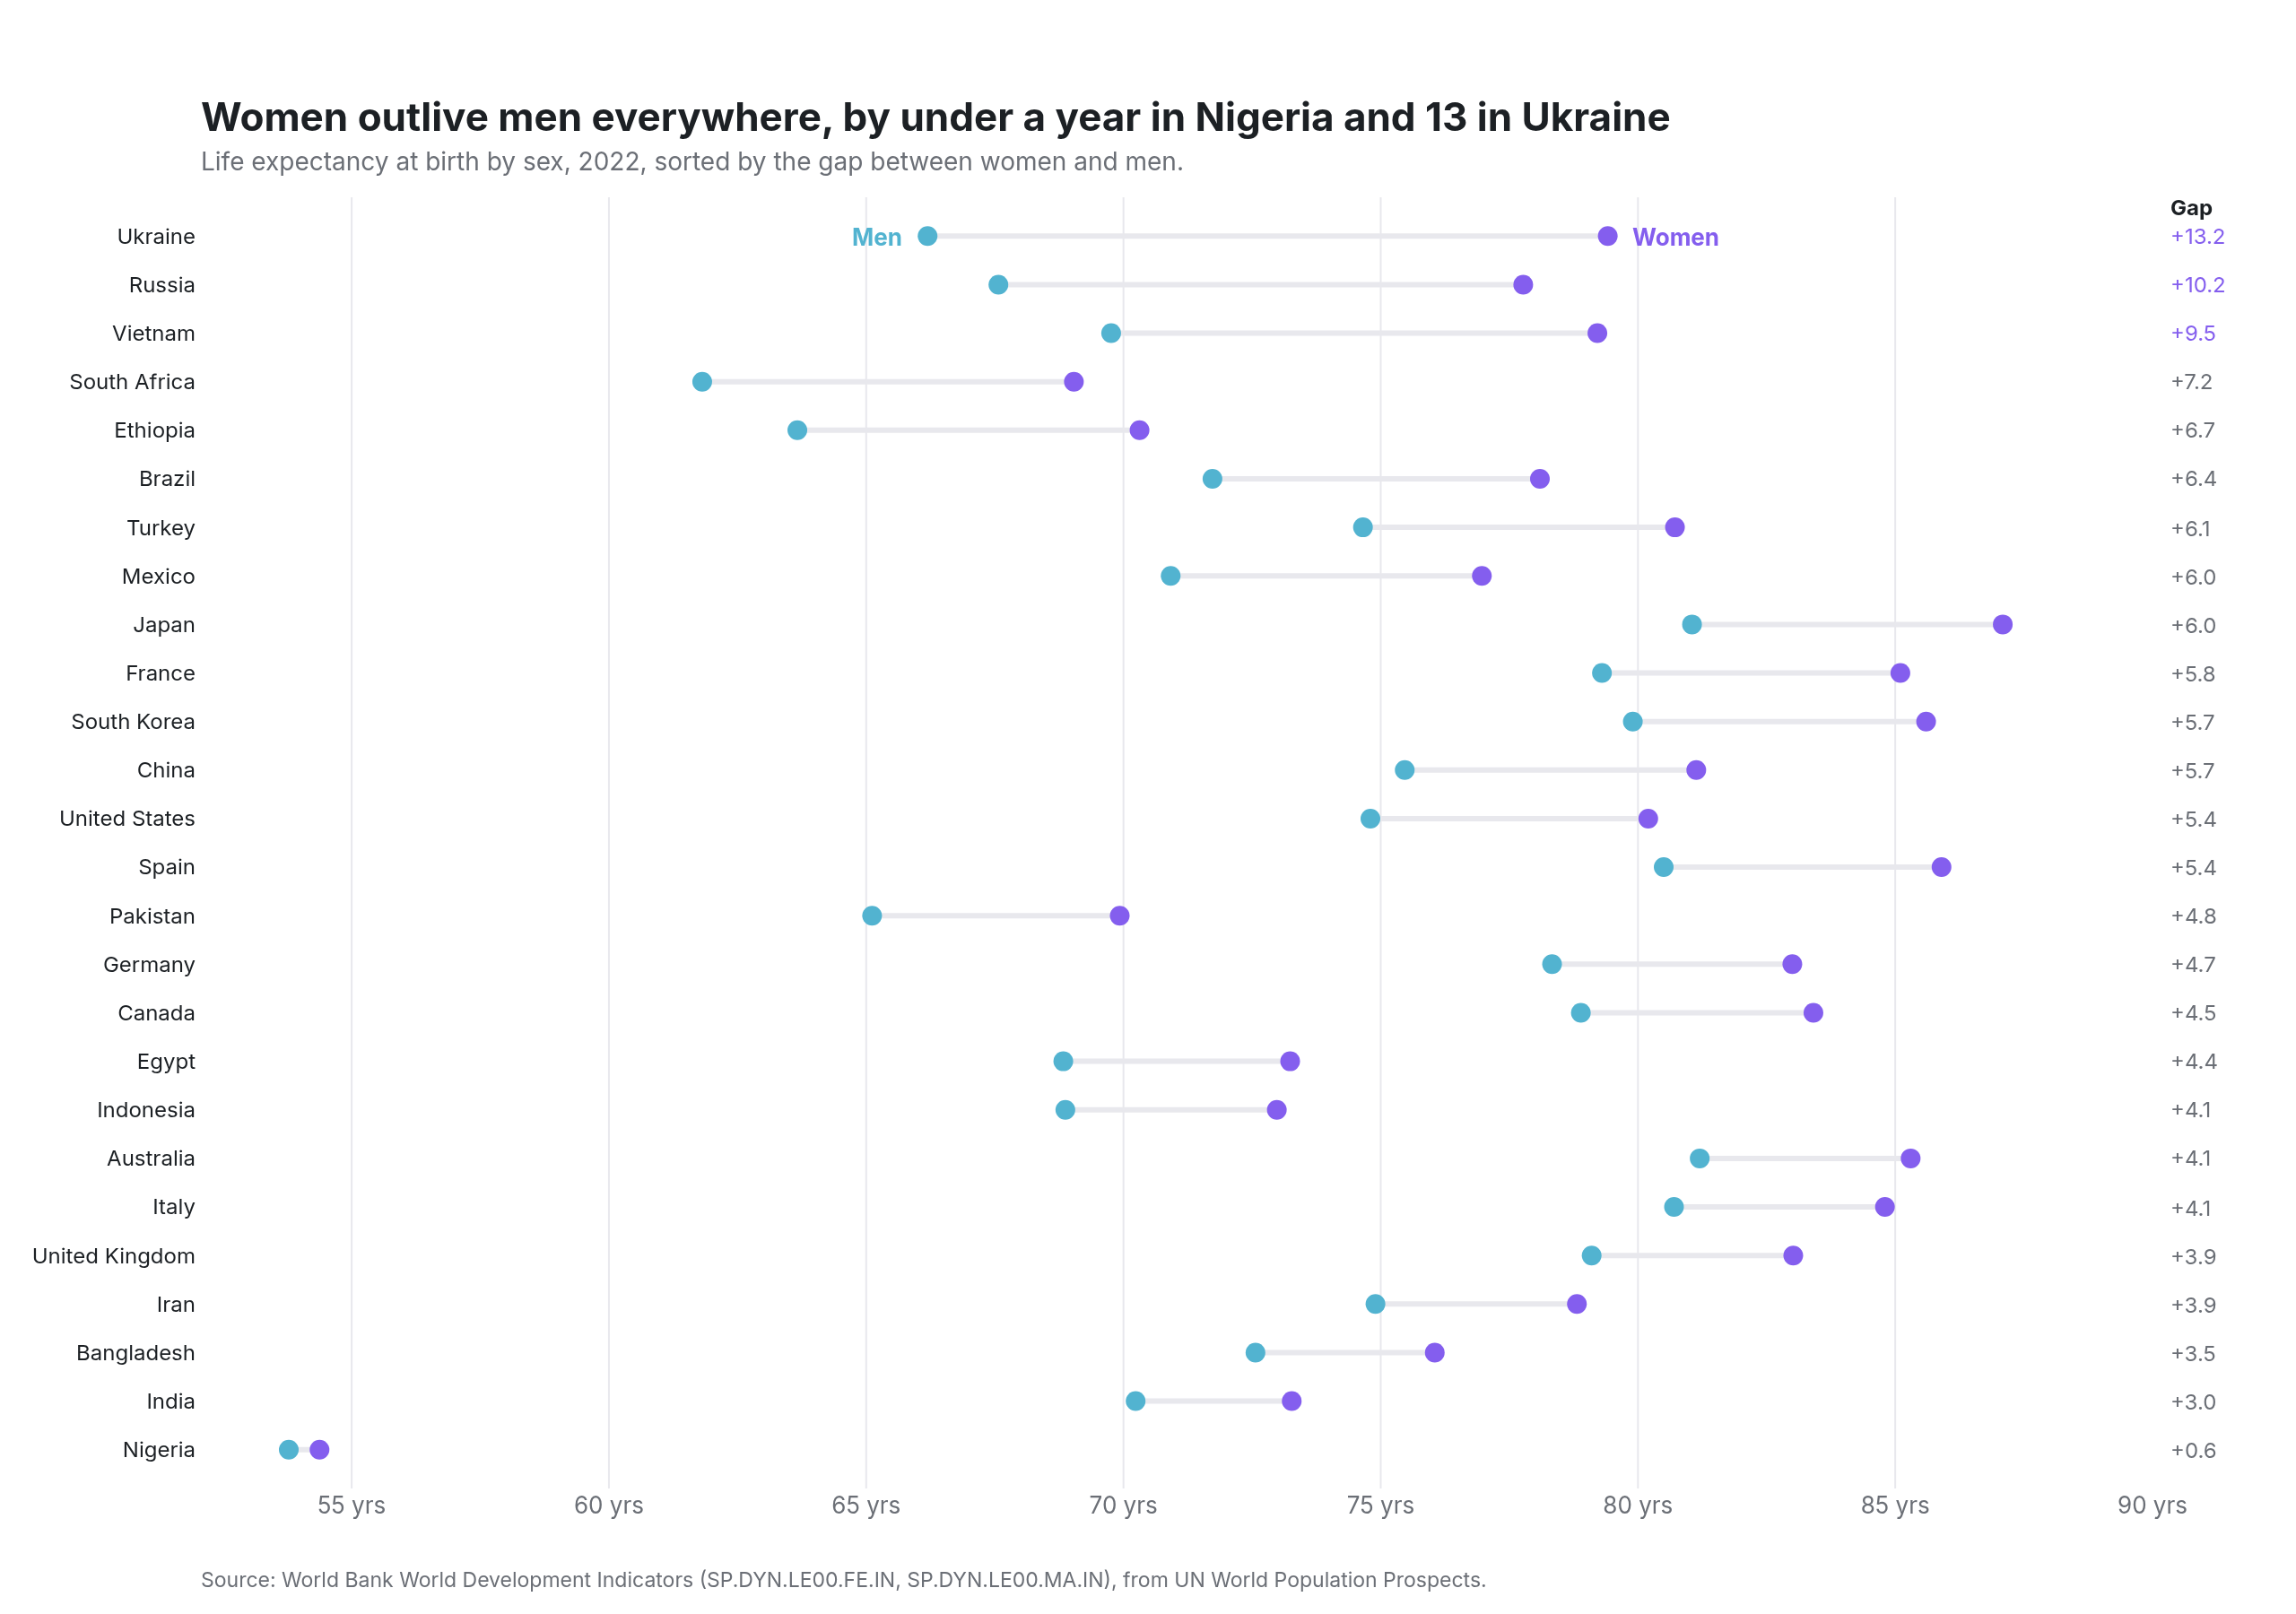
Dumbbell chart
the life-expectancy gap between women and men, 2022
Example from Plotly for highly customizable print-ready data visualization · shared helpers
Python Code
"""Dumbbell chart — the life-expectancy gap between women and men, 2022.

Two dots joined by a rule for each country, sorted by the size of the gap,
with the gap itself written at the right edge and the two sexes identified
once in the header rather than in a legend.
"""
from pathlib import Path

from _shared import fetch_json, save, base_layout, titles, INK, MUTED, FAINT, GRID, VIOLET, TEAL

import numpy as np
import plotly.graph_objects as go

CHART_NUM = 21
YEAR = 2022
CODES = ["JPN", "KOR", "FRA", "ESP", "ITA", "DEU", "GBR", "USA", "CAN", "AUS", "CHN", "IND", "BRA", "MEX", "RUS", "UKR",
         "TUR", "IRN", "EGY", "NGA", "ZAF", "ETH", "IDN", "VNM", "BGD", "PAK"]


def wb(indicator):
    url = f"https://api.worldbank.org/v2/country/all/indicator/{indicator}?date={YEAR}&format=json&per_page=400"
    return {r["countryiso3code"]: (r["country"]["value"], r["value"]) for r in fetch_json(url)[1] if r["value"] is not None}


def generate():
    women, men = wb("SP.DYN.LE00.FE.IN"), wb("SP.DYN.LE00.MA.IN")
    rows = [(women[c][0].replace("Russian Federation", "Russia").replace("Korea, Rep.", "South Korea").replace("Iran, Islamic Rep.", "Iran")
             .replace("Egypt, Arab Rep.", "Egypt").replace("Viet Nam", "Vietnam").replace("Turkiye", "Turkey"), women[c][1], men[c][1])
            for c in CODES if c in women and c in men]
    rows.sort(key=lambda r: r[1] - r[2])
    names = [r[0] for r in rows]
    w = np.array([r[1] for r in rows]); m = np.array([r[2] for r in rows])

    fig = go.Figure()
    for i, (name, wv, mv) in enumerate(rows):
        fig.add_trace(go.Scatter(x=[mv, wv], y=[i, i], mode="lines", line=dict(color=GRID, width=3), hoverinfo="skip"))
    fig.add_trace(go.Scatter(x=m, y=list(range(len(rows))), mode="markers", name="Men", marker=dict(size=11, color=TEAL),
                             hovertemplate="%{text}: men %{x:.1f}<extra></extra>", text=names))
    fig.add_trace(go.Scatter(x=w, y=list(range(len(rows))), mode="markers", name="Women", marker=dict(size=11, color=VIOLET),
                             hovertemplate="%{text}: women %{x:.1f}<extra></extra>", text=names))
    for i, (name, wv, mv) in enumerate(rows):
        fig.add_annotation(x=1.0, y=i, xref="paper", text=f"+{wv - mv:.1f}", showarrow=False, xanchor="left", xshift=8,
                           font=dict(size=12, color=VIOLET if wv - mv >= 8 else MUTED, family="Inter"))
    fig.add_annotation(x=1.0, y=len(rows) - 0.4, xref="paper", text="<b>Gap</b>", showarrow=False, xanchor="left", xshift=8, font=dict(size=12, color=INK))
    fig.add_annotation(x=m[-1], y=len(rows) - 1, text="<b>Men</b>", showarrow=False, xanchor="right", xshift=-12, font=dict(size=13, color=TEAL))
    fig.add_annotation(x=w[-1], y=len(rows) - 1, text="<b>Women</b>", showarrow=False, xanchor="left", xshift=12, font=dict(size=13, color=VIOLET))
    fig.update_layout(**base_layout(margin=dict(l=110, r=80, t=110, b=70)))
    fig.update_xaxes(range=[52, 90], dtick=5, ticksuffix=" yrs", showgrid=True)
    fig.update_yaxes(tickvals=list(range(len(rows))), ticktext=names, showgrid=False, tickfont=dict(size=12, color=INK), range=[-0.8, len(rows) - 0.2])
    g0, g1 = w[0] - m[0], w[-1] - m[-1]
    titles(fig, f"Women outlive men everywhere, by {'under a year' if g0 < 1 else f'{g0:.0f} years'} in {names[0]} and {g1:.0f} in {names[-1]}",
           f"Life expectancy at birth by sex, {YEAR}, sorted by the gap between women and men.",
           "Source: World Bank World Development Indicators (SP.DYN.LE00.FE.IN, SP.DYN.LE00.MA.IN), from UN World Population Prospects.")
    save(CHART_NUM, fig, width=1280, height=900)
Made with Plotly