
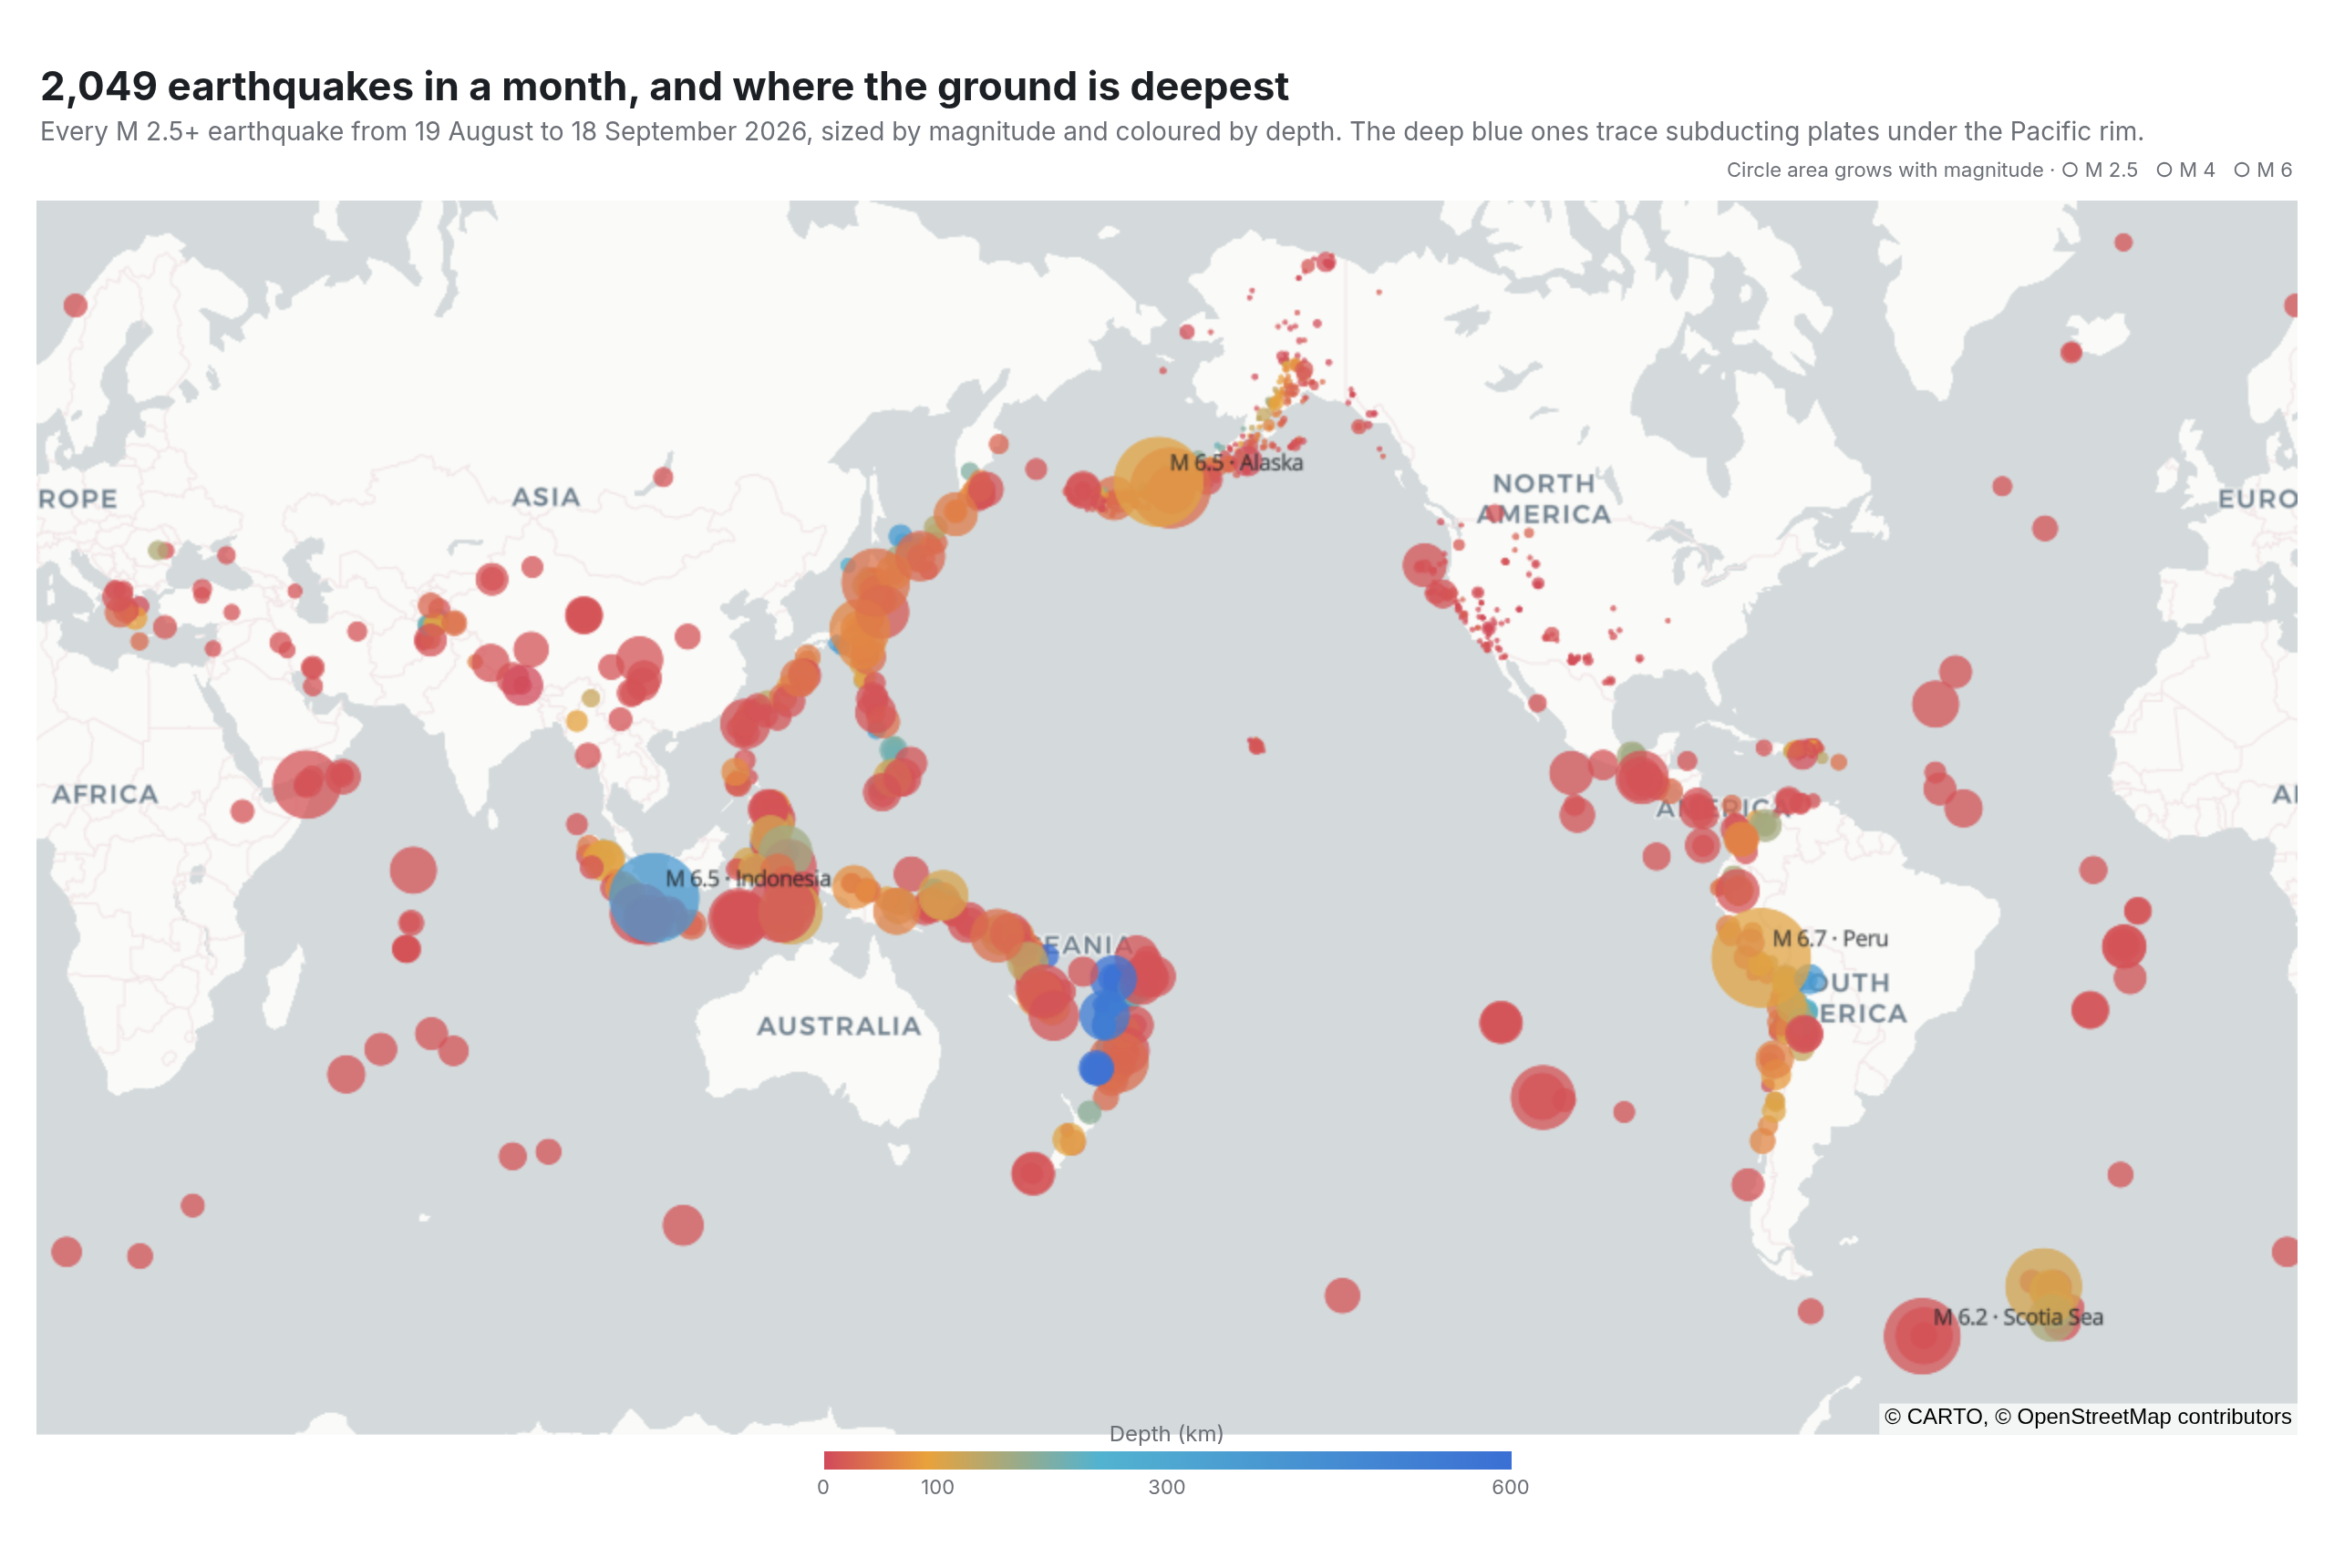
Earthquake map
a month of M2.5+ earthquakes on a MapLibre basemap
Example from Plotly for highly customizable print-ready data visualization · shared helpers
Python Code
"""Earthquake map — a month of M2.5+ earthquakes on a MapLibre basemap.

The new `map` traces (MapLibre, no token): every event as a circle sized by
magnitude and coloured by depth over a muted Carto basemap, the biggest
quakes named on the map with a second text-only trace, a horizontal depth
bar, and the view centred on the Pacific so the ring of fire closes.
"""
from pathlib import Path

from _shared import fetch_csv, save, base_layout, titles, INK, MUTED, hex_to_rgba

import numpy as np
import pandas as pd
import plotly.graph_objects as go

CHART_NUM = 27
URL = "https://earthquake.usgs.gov/earthquakes/feed/v1.0/summary/2.5_month.csv"
DEPTH = [[0.0, "#d1495b"], [0.15, "#e9a23b"], [0.4, "#52b3d0"], [1.0, "#3b6fd4"]]   # shallow → deep


def generate():
    df = fetch_csv(URL, parse_dates=["time"]).dropna(subset=["mag", "depth"]).sort_values("mag")
    size = 4 + (df["mag"] - 2.5).clip(lower=0) ** 2.2 * 2.2   # roughly area ∝ energy released
    biggest = df.nlargest(6, "mag")
    fig = go.Figure()
    fig.add_trace(go.Scattermap(
        lat=df["latitude"], lon=df["longitude"], mode="markers",
        marker=dict(size=size, color=df["depth"], colorscale=DEPTH, cmin=0, cmax=600, opacity=0.75,
                    colorbar=dict(title=dict(text="Depth (km)", side="top", font=dict(size=12, color=MUTED)), orientation="h",
                                  x=0.5, y=0.0, len=0.32, thickness=10, tickvals=[0, 100, 300, 600], tickfont=dict(size=11, color=MUTED), outlinewidth=0)),
        customdata=np.c_[df["mag"], df["depth"], df["place"], df["time"].dt.strftime("%-d %b")],
        hovertemplate="<b>M %{customdata[0]:.1f}</b> · %{customdata[2]}<br>%{customdata[3]} · %{customdata[1]:.0f} km deep<extra></extra>",
        name="earthquakes",
    ))
    fig.add_trace(go.Scattermap(
        lat=biggest["latitude"], lon=biggest["longitude"], mode="markers+text",
        # A text-only scattermap with a textposition trips MapLibre's layer builder; an invisible marker sidesteps it.
        marker=dict(size=1, opacity=0),
        text=[f"M {m:.1f} · {p.split(', ')[-1]}" for m, p in zip(biggest["mag"], biggest["place"])],
        textposition="top right", textfont=dict(size=12, color=INK), hoverinfo="skip", name="largest",
    ))
    fig.update_layout(**base_layout(margin=dict(l=20, r=20, t=110, b=30)))
    fig.update_layout(map=dict(style="carto-positron", center=dict(lat=8, lon=-170), zoom=1.25, bearing=0, pitch=0),
                      map_domain=dict(x=[0, 1], y=[0.06, 1]))
    fig.add_annotation(x=1, y=1, xref="paper", yref="paper", xanchor="right", yanchor="bottom", yshift=8, showarrow=False,
                       text="Circle area grows with magnitude · ○ M 2.5   ○ M 4   ○ M 6", font=dict(size=11, color=MUTED))
    t0, t1 = df["time"].min(), df["time"].max()
    titles(fig, f"{len(df):,} earthquakes in a month, and where the ground is deepest",
           f"Every M 2.5+ earthquake from {t0:%-d %B} to {t1:%-d %B %Y}, sized by magnitude and coloured by depth. "
           "The deep blue ones trace subducting plates under the Pacific rim.",
           "Source: USGS Earthquake Hazards Program, real-time feed (2.5_month.csv). Basemap: CARTO Positron on MapLibre, © OpenStreetMap contributors.", lift=18)
    save(CHART_NUM, fig, width=1280, height=860)
Made with Plotly