
Energy Sankey
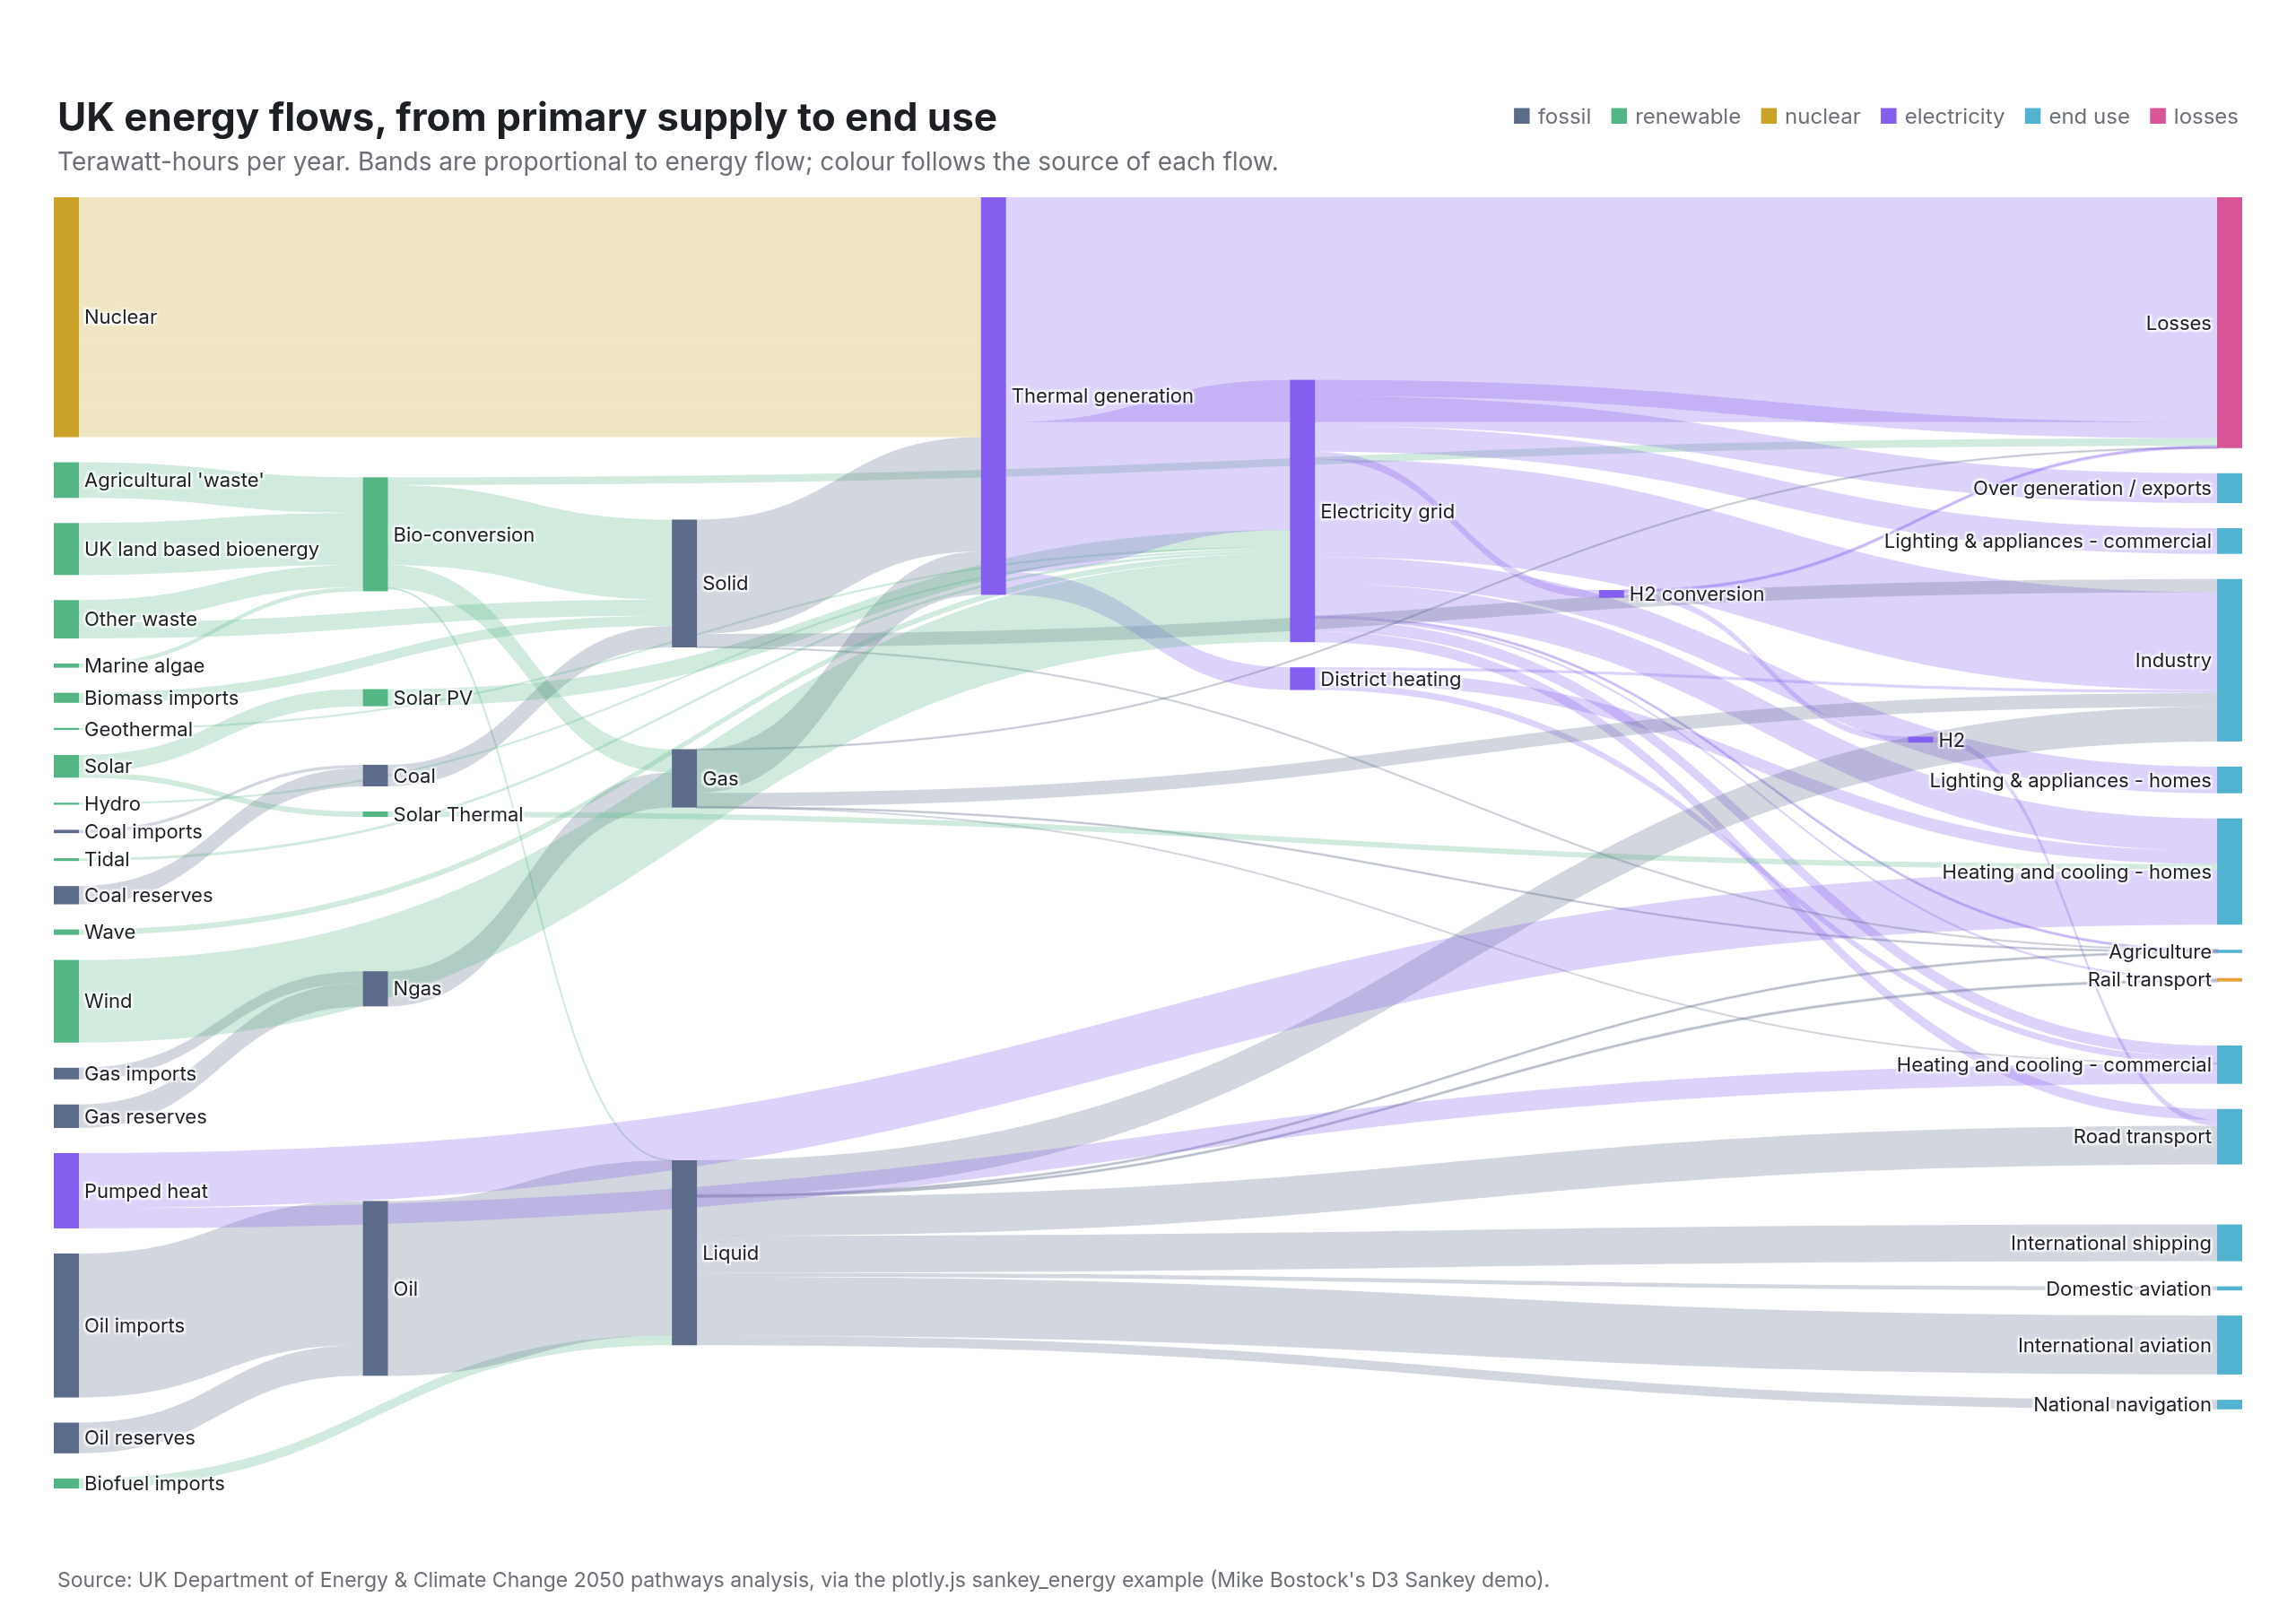
where the UK's energy came from and went, restyled
Example from Plotly for highly customizable print-ready data visualization · shared helpers
Python Code
"""Energy Sankey — where the UK's energy came from and went, restyled.

The D3/plotly.js demo dataset in a print treatment: nodes coloured by the
kind of thing they are (source, carrier, sector, loss), links inheriting a
translucent version of their source's colour, and every label set in the
chart's own typeface with the totals typed in.
"""
from pathlib import Path

from _shared import fetch_json, save, base_layout, titles, INK, MUTED, FAINT, VIOLET, TEAL, GREEN, PINK, ORANGE, SLATE, GOLD, hex_to_rgba

import plotly.graph_objects as go

CHART_NUM = 12
URL = "https://raw.githubusercontent.com/plotly/plotly.js/master/test/image/mocks/sankey_energy.json"
KIND = {
    "fossil": (["Coal", "Coal imports", "Coal reserves", "Oil", "Oil imports", "Oil reserves", "Gas", "Gas imports", "Gas reserves", "Ngas", "Petroleum", "Liquid", "Solid"], SLATE),
    "renewable": (["Wind", "Wave", "Tidal", "Solar", "Solar PV", "Solar Thermal", "Hydro", "Geothermal", "Biomass imports", "Bio-conversion", "Biofuel imports", "Agricultural 'waste'", "Marine algae", "UK land based bioenergy", "Other waste"], GREEN),
    "nuclear": (["Nuclear"], GOLD),
    "electricity": (["Electricity grid", "Thermal generation", "CHP", "District heating", "H2", "H2 conversion", "Pumped heat"], VIOLET),
    "end use": (["Industry", "Road transport", "Domestic aviation", "International aviation", "International shipping", "National navigation", "Rail", "Heating and cooling - homes", "Heating and cooling - commercial", "Lighting & appliances - homes", "Lighting & appliances - commercial", "Over generation / exports", "Agriculture"], TEAL),
    "losses": (["Losses"], PINK),
}


def generate():
    mock = fetch_json(URL)["data"][0]
    labels = mock["node"]["label"]
    colors = []
    for lab in labels:
        c = ORANGE
        for names, col in KIND.values():
            if lab in names:
                c = col
        colors.append(c)
    link = mock["link"]
    link_colors = [hex_to_rgba(colors[s], 0.28) for s in link["source"]]

    fig = go.Figure(go.Sankey(
        arrangement="snap", valueformat=",.0f", valuesuffix=" TWh",
        node=dict(label=labels, color=colors, pad=14, thickness=14, line=dict(width=0),
                  hovertemplate="%{label}: %{value:,.0f} TWh<extra></extra>"),
        link=dict(source=link["source"], target=link["target"], value=link["value"], color=link_colors,
                  hovertemplate="%{source.label} → %{target.label}: %{value:,.0f} TWh<extra></extra>"),
        textfont=dict(size=11, color=INK),
    ))
    fig.update_layout(**base_layout(margin=dict(l=30, r=30, t=110, b=70)))
    key = "   ".join(f"<span style='color:{col}'>■</span> {k}" for k, (_, col) in KIND.items())
    fig.add_annotation(x=1, y=1, xref="paper", yref="paper", xanchor="right", yanchor="bottom", yshift=36, showarrow=False,
                       text=key, font=dict(size=12, color=MUTED))
    titles(fig, "UK energy flows, from primary supply to end use",
           "Terawatt-hours per year. Bands are proportional to energy flow; colour follows the source of each flow.",
           "Source: UK Department of Energy & Climate Change 2050 pathways analysis, via the plotly.js sankey_energy example (Mike Bostock's D3 Sankey demo).")
    save(CHART_NUM, fig, width=1280, height=900)
Made with Plotly