
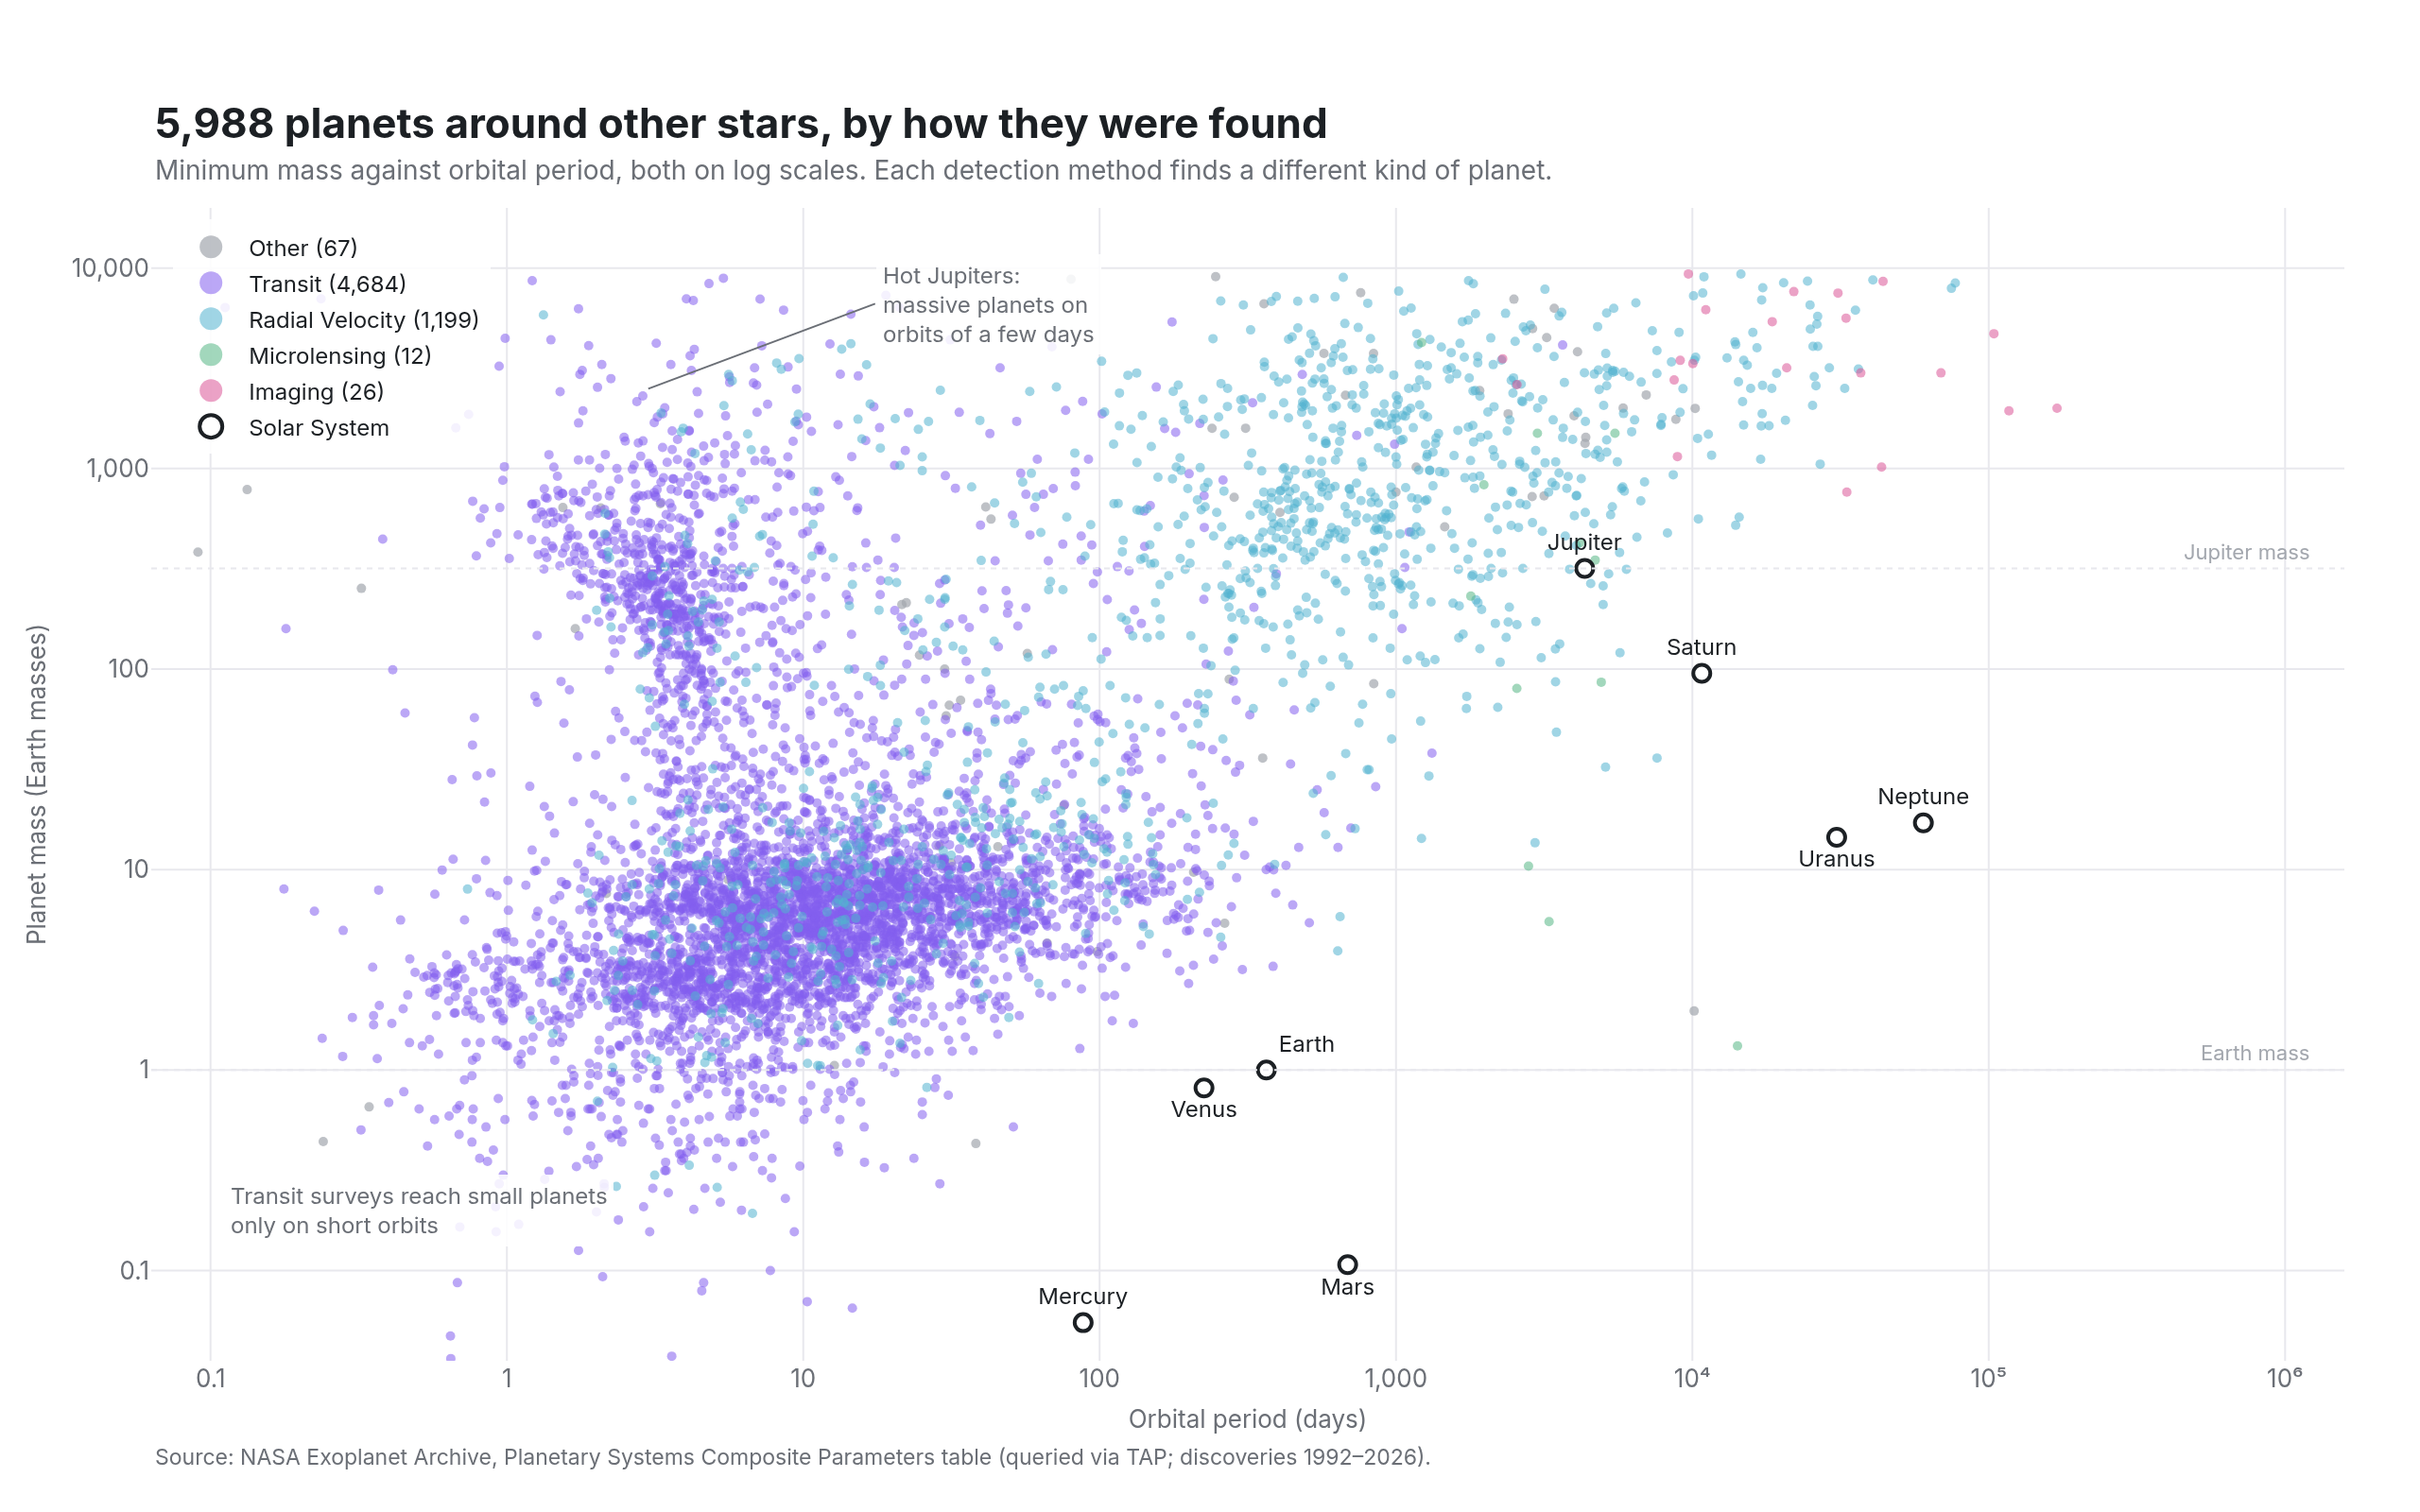
Exoplanet scatter
mass against orbital period for 6,000 known planets
Example from Plotly for highly customizable print-ready data visualization · shared helpers
Python Code
"""Exoplanet scatter — mass against orbital period for 6,000 known planets.

A log–log discovery plot in the style of the NASA Exoplanet Archive: points
coloured by detection method, the Solar System planets drawn as labelled
reference marks, and the selection biases of each method visible as the
bands the points fall into.
"""
from pathlib import Path

from _shared import fetch_csv, save, base_layout, titles, INK, MUTED, FAINT, GRID, VIOLET, TEAL, GREEN, PINK, ORANGE, hex_to_rgba

import numpy as np
import plotly.graph_objects as go

CHART_NUM = 13
URL = ("https://exoplanetarchive.ipac.caltech.edu/TAP/sync?query=select+pl_name,discoverymethod,disc_year,"
       "pl_orbper,pl_bmasse,pl_rade+from+pscomppars&format=csv")
METHODS = [("Transit", VIOLET), ("Radial Velocity", TEAL), ("Microlensing", GREEN), ("Imaging", PINK)]
SOLAR = [("Mercury", 88, 0.055), ("Venus", 225, 0.815), ("Earth", 365.25, 1), ("Mars", 687, 0.107),
         ("Jupiter", 4333, 317.8), ("Saturn", 10759, 95.2), ("Uranus", 30687, 14.5), ("Neptune", 60190, 17.1)]


def generate():
    df = fetch_csv(URL).dropna(subset=["pl_orbper", "pl_bmasse"])
    df = df[(df["pl_orbper"] > 0) & (df["pl_bmasse"] > 0)]
    fig = go.Figure()
    named = {m for m, _ in METHODS}
    other = df[~df["discoverymethod"].isin(named)]
    fig.add_trace(go.Scatter(x=other["pl_orbper"], y=other["pl_bmasse"], mode="markers", name=f"Other ({len(other)})",
                             marker=dict(size=5, color=hex_to_rgba(FAINT, 0.7)), text=other["pl_name"],
                             hovertemplate="%{text}<extra>%{customdata}</extra>", customdata=other["discoverymethod"]))
    for method, color in METHODS:
        g = df[df["discoverymethod"] == method]
        fig.add_trace(go.Scatter(x=g["pl_orbper"], y=g["pl_bmasse"], mode="markers", name=f"{method} ({len(g):,})",
                                 marker=dict(size=5, color=hex_to_rgba(color, 0.55), line=dict(width=0)),
                                 text=g["pl_name"], hovertemplate="%{text}<br>P = %{x:.2f} d, M = %{y:.2f} M⊕<extra>" + method + "</extra>"))
    fig.add_trace(go.Scatter(x=[p for _, p, _ in SOLAR], y=[m for _, _, m in SOLAR], mode="markers+text",
                             text=[n for n, _, _ in SOLAR],
                             textposition=["top center", "bottom center", "top right", "bottom center", "top center", "top center", "bottom center", "top center"],
                             textfont=dict(size=12, color=INK), name="Solar System",
                             marker=dict(size=9, color="white", line=dict(color=INK, width=2)), hoverinfo="text"))

    fig.update_layout(**base_layout(margin=dict(l=80, r=40, t=110, b=80), showlegend=True,
                                    legend=dict(x=0.01, y=0.99, xanchor="left", yanchor="top", bgcolor="rgba(255,255,255,0.85)",
                                                font=dict(size=12), itemsizing="constant")))
    fig.update_xaxes(type="log", title_text="Orbital period (days)", tickvals=[0.1, 1, 10, 100, 1000, 1e4, 1e5, 1e6],
                     ticktext=["0.1", "1", "10", "100", "1,000", "10⁴", "10⁵", "10⁶"], range=[-1.2, 6.2])
    fig.update_yaxes(type="log", title_text="Planet mass (Earth masses)", tickvals=[0.1, 1, 10, 100, 1000, 1e4],
                     ticktext=["0.1", "1", "10", "100", "1,000", "10,000"], range=[-1.45, 4.3])
    for m, lab in [(317.8, "Jupiter mass"), (1, "Earth mass")]:
        fig.add_hline(y=m, line=dict(color=GRID, width=1, dash="dot"))
        fig.add_annotation(x=6.1, y=np.log10(m), text=lab, showarrow=False, xanchor="right", yshift=9, font=dict(size=11, color=FAINT))
    fig.add_annotation(x=np.log10(3), y=np.log10(2500), text="Hot Jupiters:<br>massive planets on<br>orbits of a few days", showarrow=True,
                       arrowhead=0, arrowcolor=MUTED, ax=120, ay=-45, font=dict(size=12, color=MUTED), align="left", xanchor="left",
                       bgcolor="rgba(255,255,255,0.85)", borderpad=3)
    fig.add_annotation(x=np.log10(0.11), y=np.log10(0.2), text="Transit surveys reach small planets<br>only on short orbits", showarrow=False,
                       font=dict(size=12, color=MUTED), align="left", xanchor="left", bgcolor="rgba(255,255,255,0.85)", borderpad=3)
    titles(fig, f"{len(df):,} planets around other stars, by how they were found",
           "Minimum mass against orbital period, both on log scales. Each detection method finds a different kind of planet.",
           f"Source: NASA Exoplanet Archive, Planetary Systems Composite Parameters table (queried via TAP; discoveries {df['disc_year'].min():.0f}–{df['disc_year'].max():.0f}).")
    save(CHART_NUM, fig)
Made with Plotly