
Waterfall chart
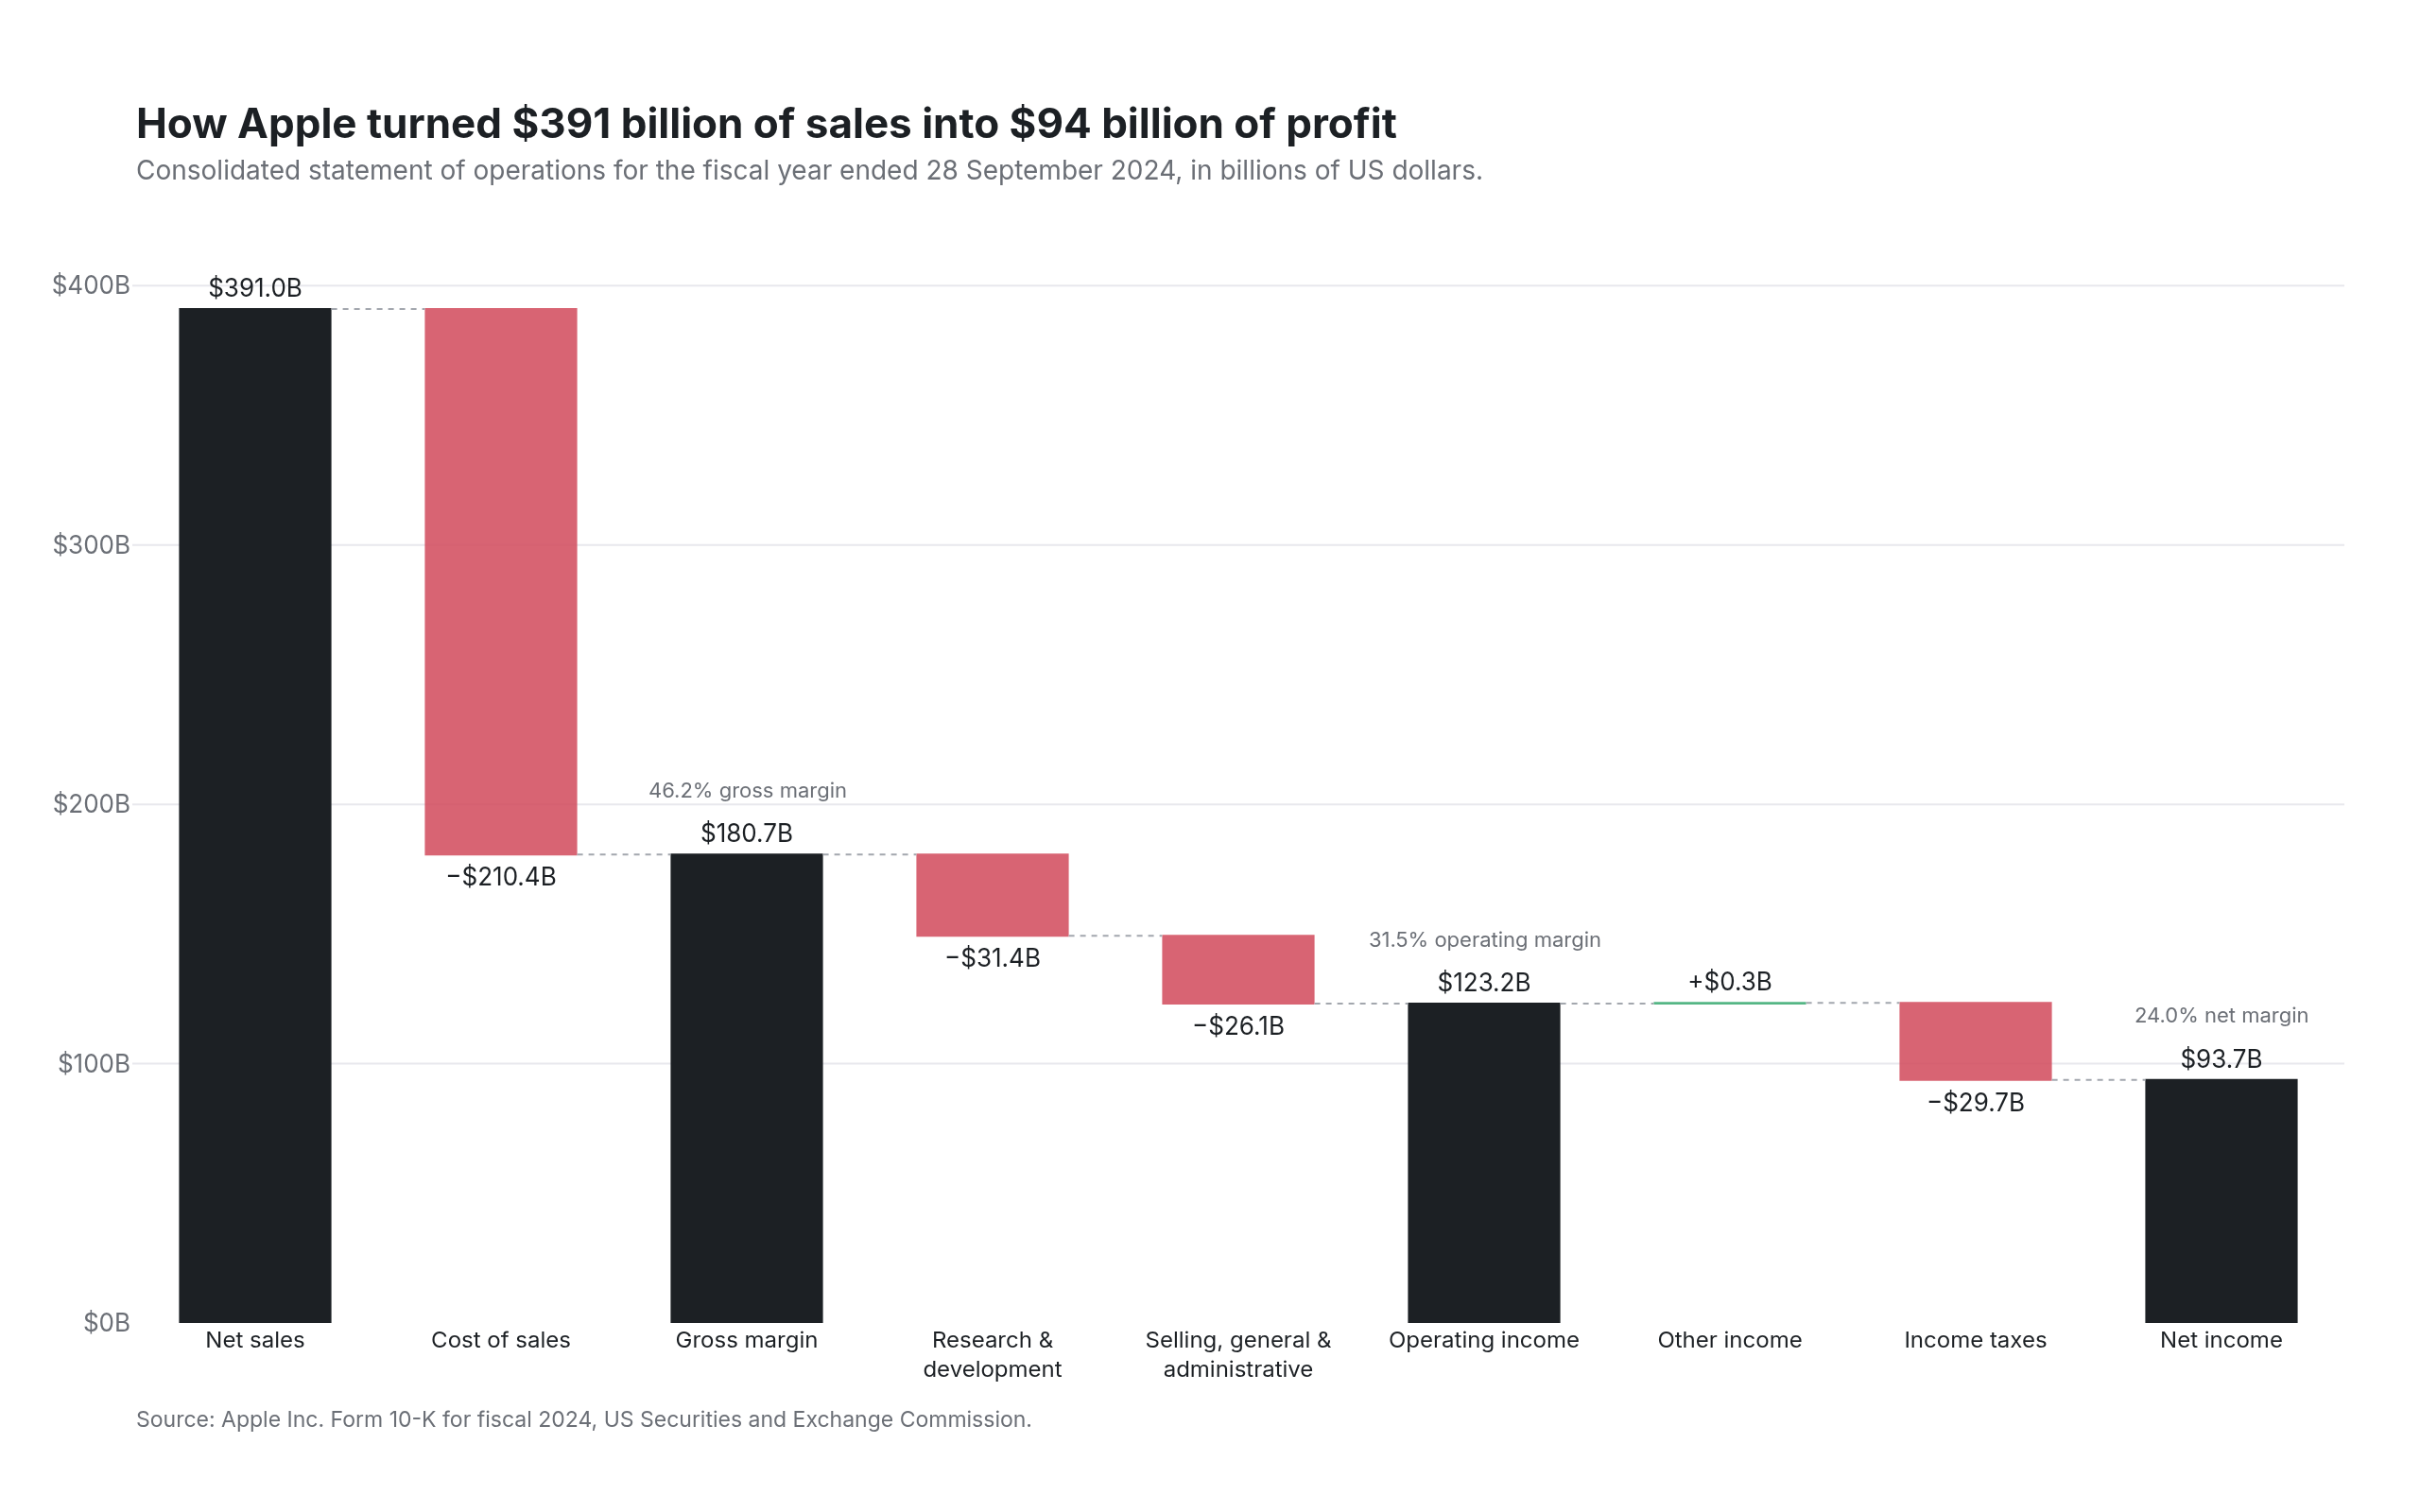
Apple's fiscal 2024 income statement, from revenue to net income
Example from Plotly for highly customizable print-ready data visualization · shared helpers
Python Code
"""Waterfall chart — Apple's fiscal 2024 income statement, from revenue to net income.

The finance-desk treatment: totals in ink, costs in red, the one small gain
in green, dotted connectors between the bars, every bar labelled in
billions, and the two margins written where a reader would look for them.
"""
from pathlib import Path

from _shared import save, base_layout, titles, INK, MUTED, FAINT, GRID, RED, GREEN, hex_to_rgba

import plotly.graph_objects as go

CHART_NUM = 20
# Apple Inc. Form 10-K, fiscal year ended 28 September 2024, in $ billions.
ITEMS = [("Net sales", 391.035, "absolute"), ("Cost of sales", -210.352, "relative"), ("Gross margin", None, "total"),
         ("Research &<br>development", -31.370, "relative"), ("Selling, general &<br>administrative", -26.097, "relative"),
         ("Operating income", None, "total"), ("Other income", 0.269, "relative"), ("Income taxes", -29.749, "relative"),
         ("Net income", None, "total")]


def generate():
    labels = [n for n, _, _ in ITEMS]
    values = [v if v is not None else 0 for _, v, _ in ITEMS]
    measures = [m for _, _, m in ITEMS]
    running, texts = 0, []
    for v, m in zip(values, measures):
        running = running + v if m != "absolute" else v
        texts.append(f"${running:,.1f}B" if m in ("absolute", "total") else f"{'+' if v > 0 else '−'}${abs(v):,.1f}B")
    fig = go.Figure(go.Waterfall(
        x=labels, y=values, measure=measures, text=texts, textposition="outside", textfont=dict(size=13, color=INK),
        connector=dict(line=dict(color=FAINT, width=1, dash="dot")),
        increasing=dict(marker=dict(color=GREEN)), decreasing=dict(marker=dict(color=hex_to_rgba(RED, 0.85))),
        totals=dict(marker=dict(color=INK)), width=0.62, cliponaxis=False,
        hovertemplate="%{x}: %{text}<extra></extra>",
    ))
    fig.update_layout(**base_layout(margin=dict(l=70, r=40, t=110, b=100), waterfallgap=0.3))
    fig.update_yaxes(range=[0, 430], tickprefix="$", ticksuffix="B", dtick=100)
    fig.update_xaxes(tickfont=dict(size=12, color=INK), showgrid=False)
    gm = 180.683 / 391.035 * 100
    om = 123.216 / 391.035 * 100
    nm = 93.736 / 391.035 * 100
    for x, y, txt in [(2, 180.683, f"{gm:.1f}% gross margin"), (5, 123.216, f"{om:.1f}% operating margin"), (8, 93.736, f"{nm:.1f}% net margin")]:
        fig.add_annotation(x=x, y=y, text=txt, showarrow=False, yshift=34, font=dict(size=11, color=MUTED))
    titles(fig, "How Apple turned $391 billion of sales into $94 billion of profit",
           "Consolidated statement of operations for the fiscal year ended 28 September 2024, in billions of US dollars.",
           "Source: Apple Inc. Form 10-K for fiscal 2024, US Securities and Exchange Commission.")
    save(CHART_NUM, fig)
Made with Plotly