
Pattern fills
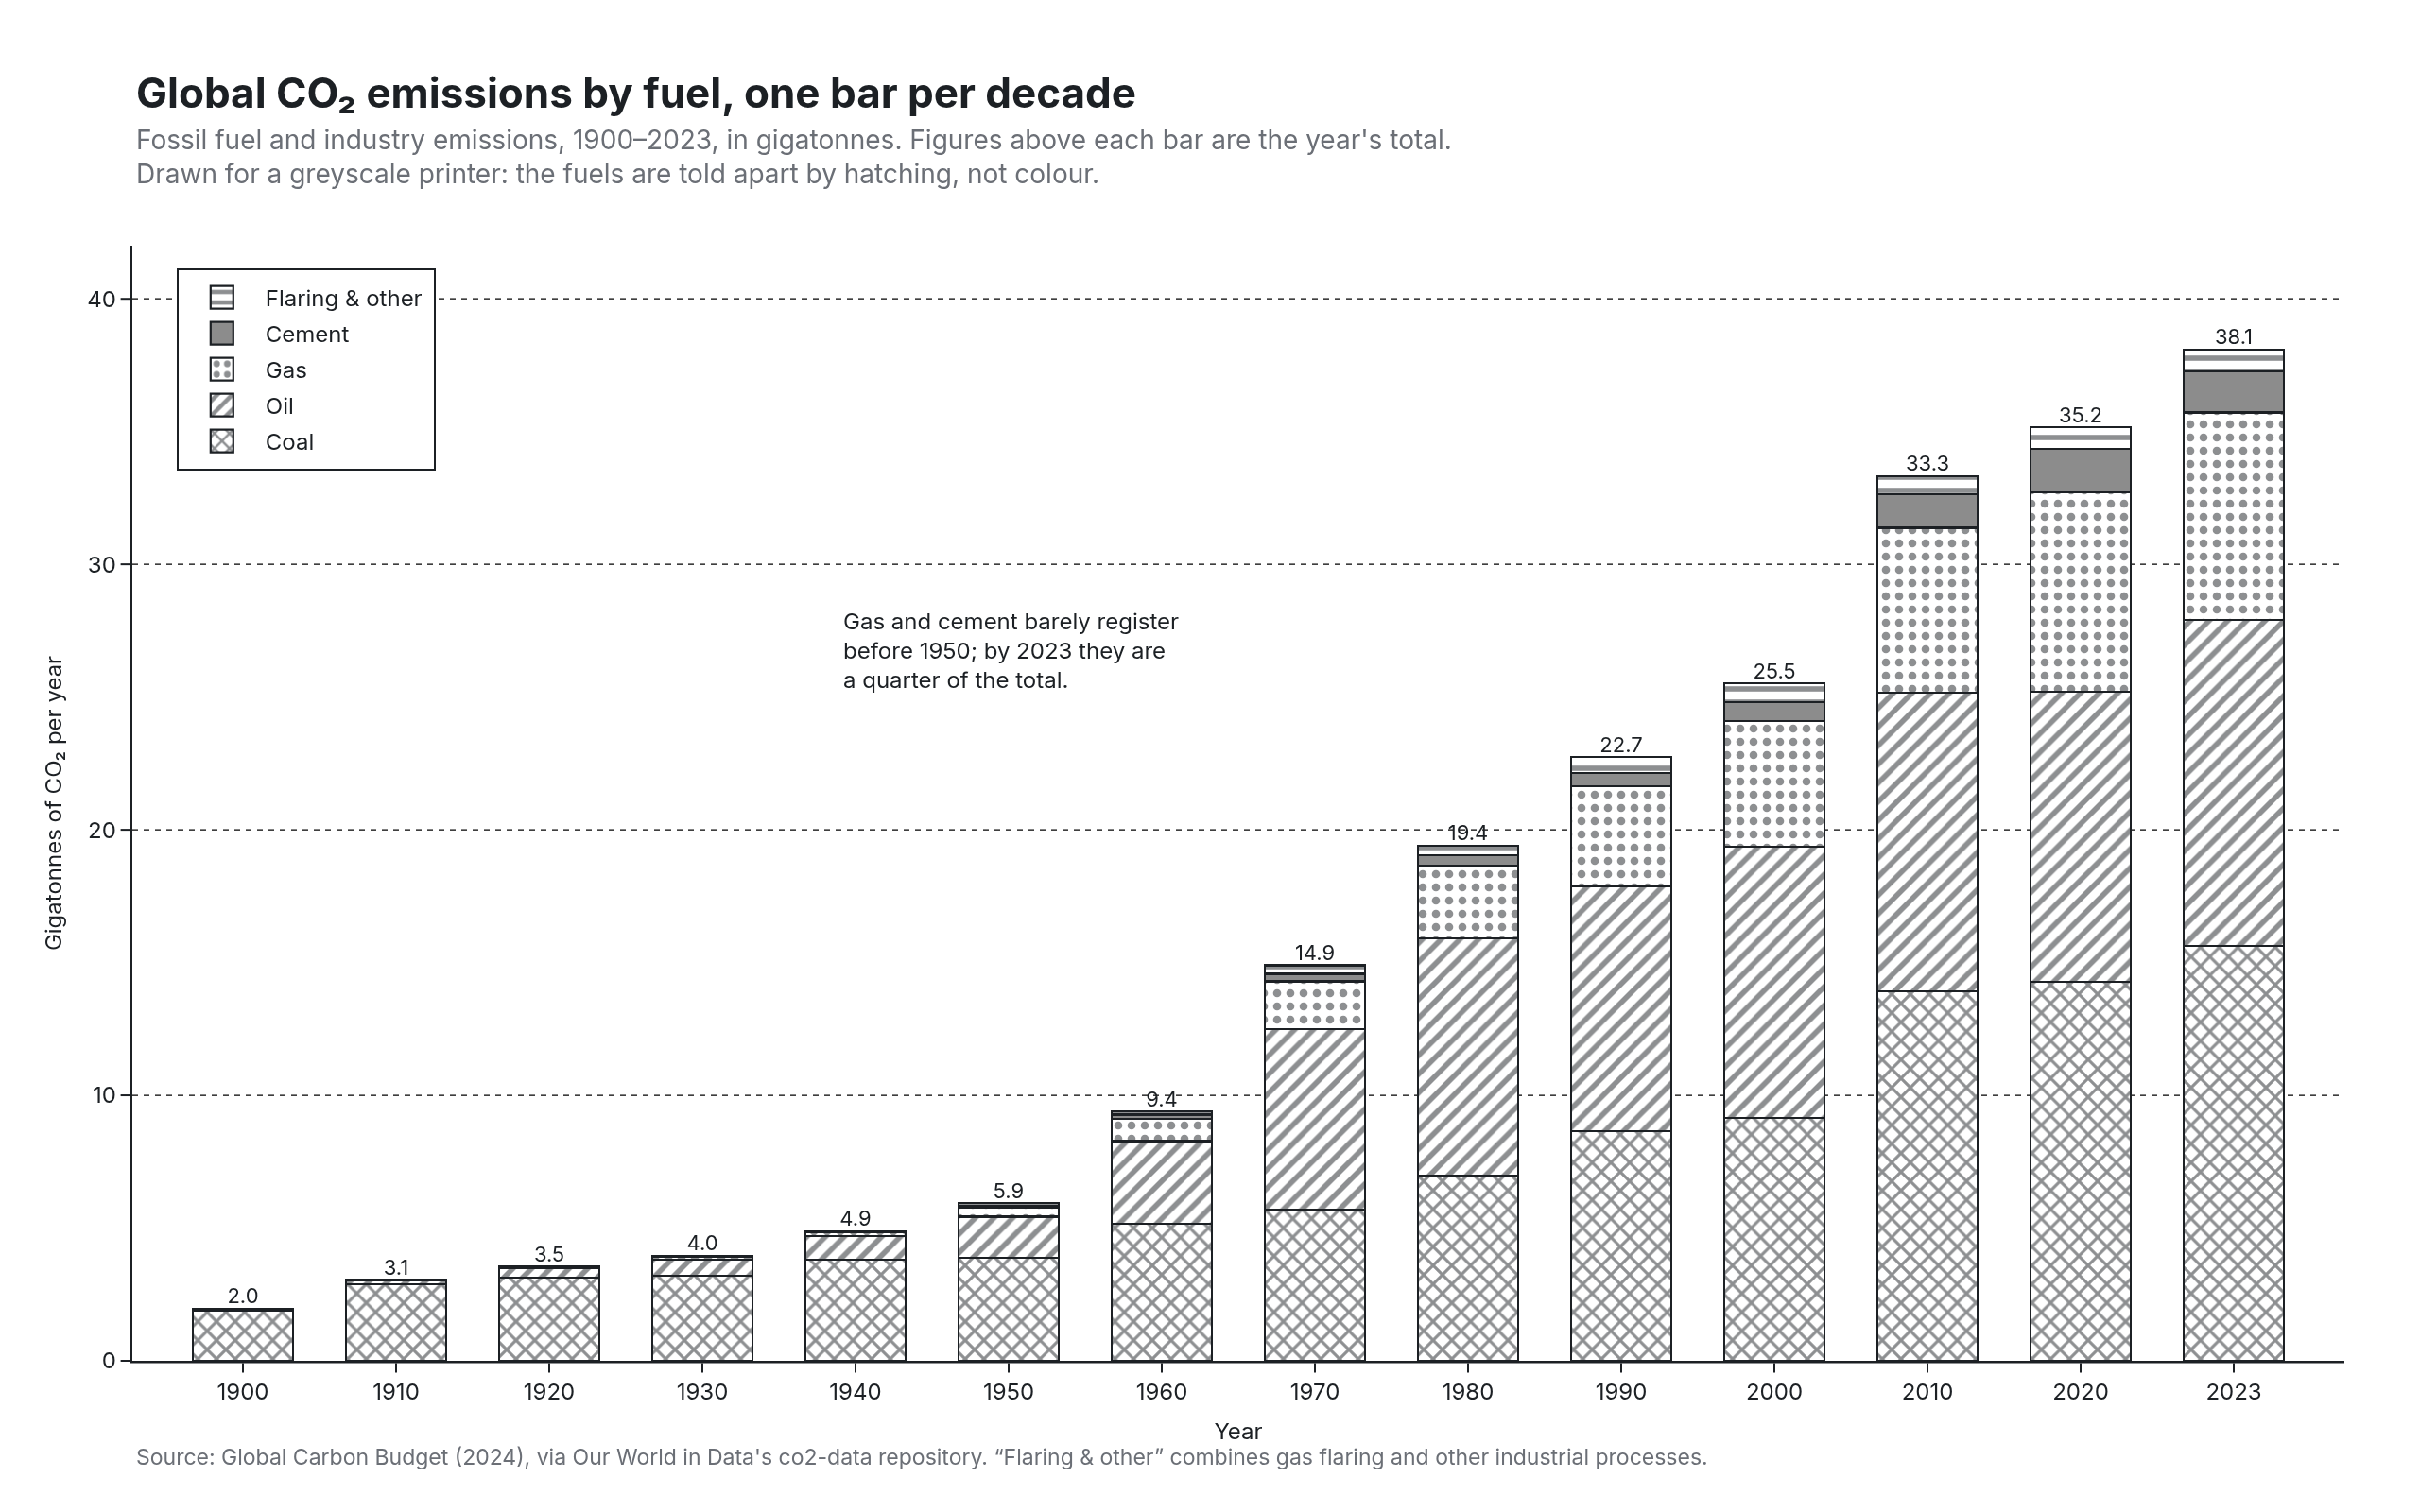
world CO₂ emissions by fuel, in black and white
Example from Plotly for highly customizable print-ready data visualization · shared helpers
Python Code
"""Pattern fills — world CO₂ emissions by fuel, in black and white.

A figure for a journal that prints in greyscale, or a photocopier: five
fuels told apart by hatching alone (Plotly's `marker.pattern`), stacked bars
by decade with a hairline outline, a legend that shows the same hatches,
and every other mark reduced to ink on paper.
"""
from pathlib import Path

from _shared import fetch_csv, save, base_layout, titles, INK, MUTED

import numpy as np
import plotly.graph_objects as go

CHART_NUM = 29
URL = "https://raw.githubusercontent.com/owid/co2-data/master/owid-co2-data.csv"
FUELS = [  # (column, label, pattern shape, foreground, background)
    ("coal_co2", "Coal", "x", INK, "#ffffff"),
    ("oil_co2", "Oil", "/", INK, "#ffffff"),
    ("gas_co2", "Gas", ".", INK, "#ffffff"),
    ("cement_co2", "Cement", "", INK, "#8c8c8c"),
    ("flaring_co2", "Flaring & other", "-", INK, "#ffffff"),
]
YEARS = list(range(1900, 2021, 10)) + [2023]


def generate():
    df = fetch_csv(URL, usecols=["country", "year"] + [c for c, *_ in FUELS] + ["other_industry_co2"])
    w = df[df["country"] == "World"].set_index("year").drop(columns="country").reindex(YEARS).fillna(0) / 1000  # Mt → Gt
    w["flaring_co2"] = w["flaring_co2"] + w["other_industry_co2"]

    fig = go.Figure()
    for colname, label, shape, fg, bg in FUELS:
        fig.add_trace(go.Bar(
            x=[str(y) for y in YEARS], y=w[colname], name=label,
            marker=dict(color=bg, line=dict(color=INK, width=1.1),
                        pattern=dict(shape=shape, fgcolor=fg, bgcolor=bg, size=7, solidity=0.4 if shape != "." else 0.3)),
            hovertemplate="%{x}: %{y:.1f} Gt<extra>" + label + "</extra>",
        ))
    total = w[[c for c, *_ in FUELS]].sum(axis=1)
    fig.add_trace(go.Scatter(x=[str(y) for y in YEARS], y=total, mode="text", text=[f"{t:.1f}" for t in total],
                             textposition="top center", textfont=dict(size=11, color=INK), hoverinfo="skip", showlegend=False, cliponaxis=False))

    ink_axis = dict(showgrid=False, showline=True, linecolor=INK, linewidth=1.2, ticks="outside", tickcolor=INK, ticklen=5,
                    tickfont=dict(size=12, color=INK), title=dict(font=dict(size=12, color=INK)), zeroline=False)
    fig.update_layout(**base_layout(barmode="stack", bargap=0.35, margin=dict(l=70, r=40, t=130, b=80), showlegend=True,
                                    font=dict(color=INK),
                                    legend=dict(x=0.02, y=0.98, xanchor="left", yanchor="top", font=dict(size=12, color=INK),
                                                bordercolor=INK, borderwidth=1, bgcolor="white", traceorder="reversed", itemwidth=36)))
    fig.update_xaxes(**ink_axis, title_text="Year")
    fig.update_yaxes(**{**ink_axis, "showgrid": True}, title_text="Gigatonnes of CO₂ per year", range=[0, 42], dtick=10,
                     gridcolor="#000000", griddash="dot", gridwidth=0.6)
    fig.add_annotation(x=0.32, y=0.68, xref="paper", yref="paper", showarrow=False, align="left", xanchor="left",
                       font=dict(size=12, color=INK), text="Gas and cement barely register<br>before 1950; by 2023 they are<br>a quarter of the total.")
    titles(fig, "Global CO₂ emissions by fuel, one bar per decade",
           f"Fossil fuel and industry emissions, 1900–2023, in gigatonnes. Figures above each bar are the year's total.<br>"
           "Drawn for a greyscale printer: the fuels are told apart by hatching, not colour.",
           "Source: Global Carbon Budget (2024), via Our World in Data's co2-data repository. “Flaring & other” combines gas flaring and other industrial processes.", lift=18)
    save(CHART_NUM, fig)
Made with Plotly