
Raincloud plot
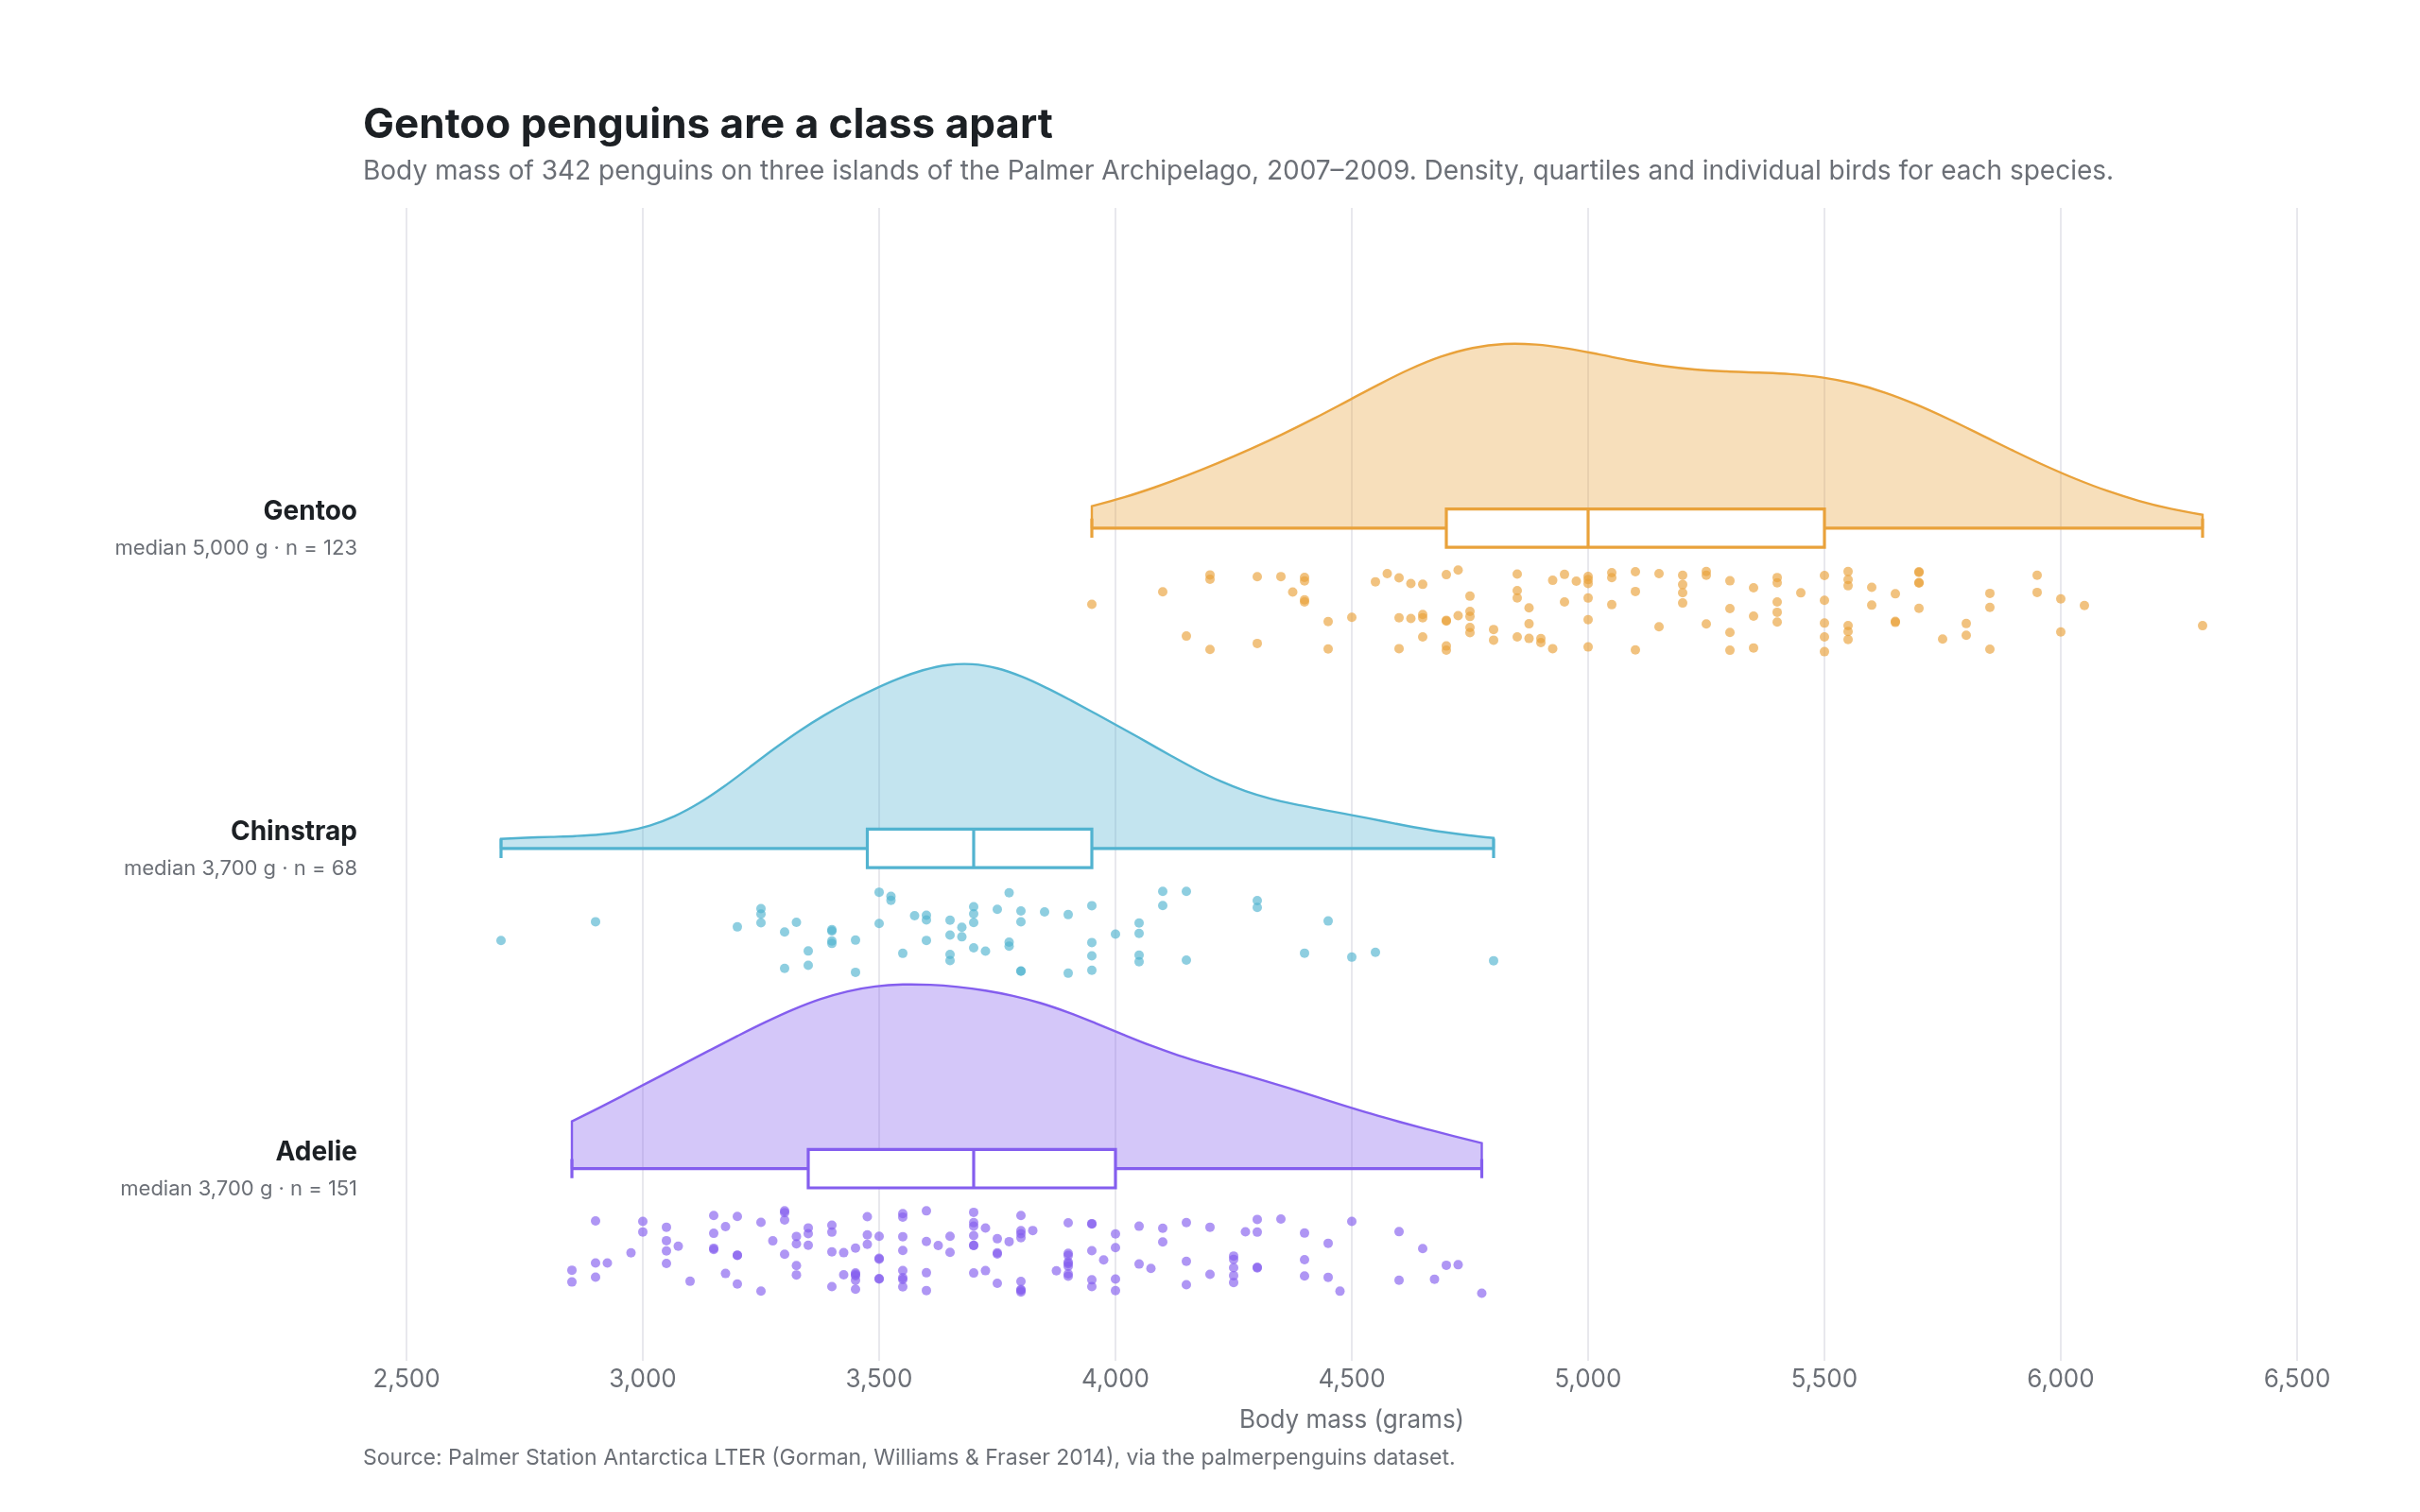
penguin body mass by species, three views of one distribution
Example from Plotly for highly customizable print-ready data visualization · shared helpers
Python Code
"""Raincloud plot — penguin body mass by species, three views of one distribution.

Half a violin for the shape, a slim box for the quartiles, and every
observation as a jittered point beneath: the layout journals have adopted
as a replacement for the bar-and-error-bar. Built from Plotly's violin and
box traces with their defaults turned off.
"""
from pathlib import Path

from _shared import fetch_csv, save, base_layout, titles, INK, MUTED, GRID, VIOLET, TEAL, ORANGE, hex_to_rgba

import numpy as np
import plotly.graph_objects as go

CHART_NUM = 16
URL = "https://raw.githubusercontent.com/mwaskom/seaborn-data/master/penguins.csv"
SPECIES = [("Adelie", VIOLET), ("Chinstrap", TEAL), ("Gentoo", ORANGE)]


def generate():
    df = fetch_csv(URL).dropna(subset=["body_mass_g"])
    rng = np.random.default_rng(1)
    fig = go.Figure()
    ticks = []
    for i, (sp, color) in enumerate(SPECIES):
        v = df.loc[df["species"] == sp, "body_mass_g"].to_numpy()
        fig.add_trace(go.Violin(x=v, y=[i] * len(v), orientation="h", side="positive", width=1.15, points=False,
                                line=dict(color=color, width=1.2), fillcolor=hex_to_rgba(color, 0.35), meanline_visible=False,
                                scalemode="width", name=sp, hoverinfo="skip", spanmode="hard"))
        fig.add_trace(go.Box(x=v, y=[i] * len(v), orientation="h", width=0.12, boxpoints=False, fillcolor="white",
                             line=dict(color=color, width=1.6), name=sp, showlegend=False,
                             hovertemplate="median %{median} g<extra>" + sp + "</extra>", offsetgroup=sp))
        fig.add_trace(go.Scatter(x=v, y=i - 0.13 - rng.uniform(0, 0.26, len(v)), mode="markers", name=sp, showlegend=False,
                                 marker=dict(size=5, color=hex_to_rgba(color, 0.65)), hovertemplate="%{x} g<extra>" + sp + "</extra>"))
        med = np.median(v)
        ticks.append(f"<b>{sp}</b><br><span style='font-size:11px;color:{MUTED}'>median {med:,.0f} g · n = {len(v)}</span>")
    fig.update_layout(**base_layout(margin=dict(l=190, r=40, t=110, b=80), violingap=0, violinmode="overlay", boxmode="overlay"))
    fig.update_xaxes(title_text="Body mass (grams)", range=[2400, 6600], dtick=500, tickformat=",")
    fig.update_yaxes(tickvals=[0, 1, 2], ticktext=ticks, tickfont=dict(size=14, color=INK), showgrid=False, range=[-0.6, 3.0])
    titles(fig, "Gentoo penguins are a class apart",
           "Body mass of 342 penguins on three islands of the Palmer Archipelago, 2007–2009. Density, quartiles and individual birds for each species.",
           "Source: Palmer Station Antarctica LTER (Gorman, Williams & Fraser 2014), via the palmerpenguins dataset.")
    save(CHART_NUM, fig)
Made with Plotly