
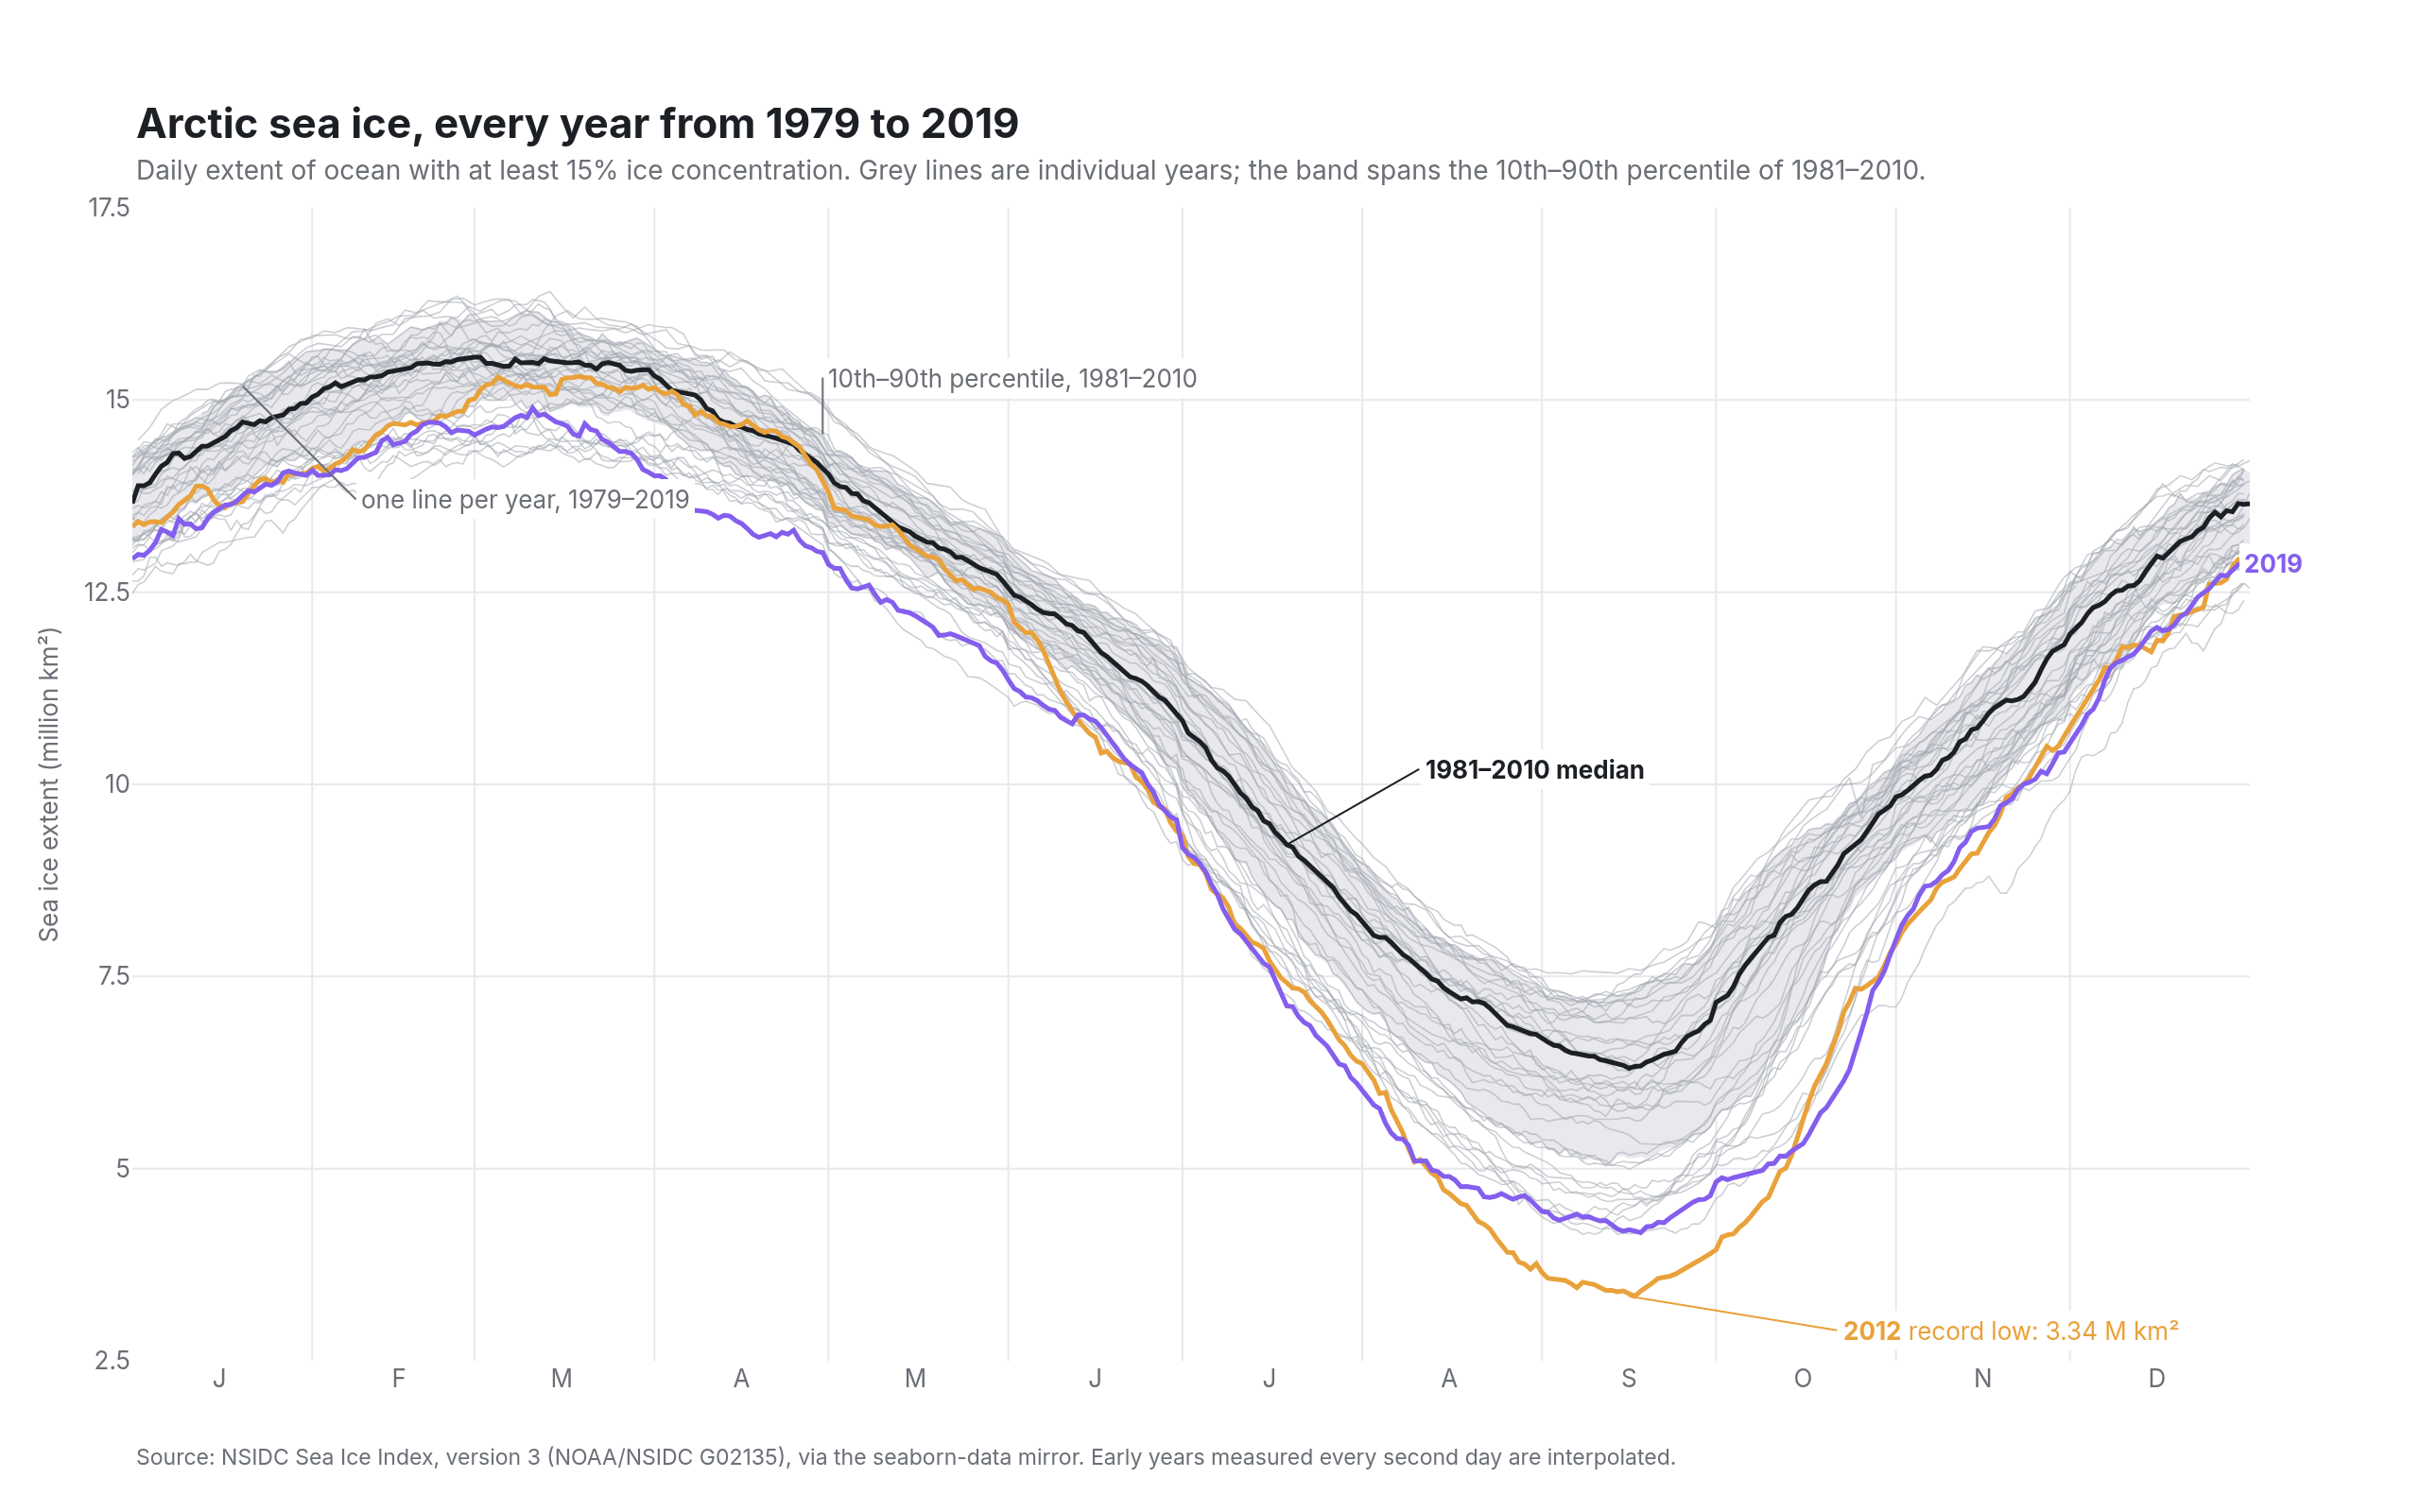
Arctic sea ice spaghetti
NSIDC Sea Ice Index daily extent, every year since 1979
Example from Plotly for highly customizable print-ready data visualization · shared helpers
Python Code
"""Arctic sea ice spaghetti — NSIDC Sea Ice Index daily extent, every year since 1979.

The NSIDC "Charctic" look: every year as a hairline, the 1981–2010 median as a
bold line inside an interdecile band, and only the record-low year and the
most recent year picked out in colour with labels on the line itself.
"""
from pathlib import Path

from _shared import fetch_text, save, base_layout, titles, INK, MUTED, FAINT, GRID, VIOLET, ORANGE, hex_to_rgba

import io
import numpy as np
import pandas as pd
import plotly.graph_objects as go

CHART_NUM = 3
URLS = [
    "https://masie_web.apps.nsidc.org/pub/DATASETS/NOAA/G02135/north/daily/data/N_seaice_extent_daily_v3.0.csv",
    "https://noaadata.apps.nsidc.org/NOAA/G02135/north/daily/data/N_seaice_extent_daily_v3.0.csv",
    "https://raw.githubusercontent.com/mwaskom/seaborn-data/master/seaice.csv",
]


def load() -> pd.DataFrame:
    for url in URLS:
        try:
            text = fetch_text(url)
        except Exception:
            continue
        if "seaborn" in url:
            df = pd.read_csv(io.StringIO(text), parse_dates=["Date"])
            df = df.rename(columns={"Extent": "extent"})
        else:
            df = pd.read_csv(io.StringIO(text), skiprows=[1], skipinitialspace=True)
            df.columns = [c.strip() for c in df.columns]
            df["Date"] = pd.to_datetime(df[["Year", "Month", "Day"]])
            df = df.rename(columns={"Extent": "extent"})[["Date", "extent"]]
        df = df.dropna()
        df["year"] = df["Date"].dt.year
        df["doy"] = df["Date"].dt.dayofyear
        return df[df["year"] >= 1979]
    raise RuntimeError("no sea-ice source reachable")


def generate():
    df = load()
    # Interpolate each year onto a daily grid (early years were every other day).
    grid = np.arange(1, 367)
    by_year = {}
    for yr, g in df.groupby("year"):
        g = g.sort_values("doy")
        if len(g) < 60:
            continue
        by_year[yr] = np.interp(grid, g["doy"], g["extent"], left=np.nan, right=np.nan)
    years = sorted(by_year)
    latest = years[-1]
    ref = np.array([by_year[y] for y in years if 1981 <= y <= 2010])
    median = np.nanmedian(ref, axis=0)
    p10, p90 = np.nanpercentile(ref, 10, axis=0), np.nanpercentile(ref, 90, axis=0)
    sept = {y: np.nanmin(by_year[y]) for y in years}
    record = min(sept, key=sept.get)

    fig = go.Figure()
    fig.add_trace(go.Scatter(x=np.r_[grid, grid[::-1]], y=np.r_[p90, p10[::-1]], fill="toself",
                             fillcolor=GRID, line=dict(width=0), hoverinfo="skip", name="10–90th pct"))
    for y in years:
        if y in (record, latest):
            continue
        fig.add_trace(go.Scatter(x=grid, y=by_year[y], mode="lines", name=str(y),
                                 line=dict(color=hex_to_rgba(FAINT, 0.55), width=0.8),
                                 hovertemplate=f"{y}<br>day %{{x}}: %{{y:.2f}} M km²<extra></extra>"))
    fig.add_trace(go.Scatter(x=grid, y=median, mode="lines", name="1981–2010 median",
                             line=dict(color=INK, width=2.5), hoverinfo="skip"))
    for y, color in [(record, ORANGE), (latest, VIOLET)]:
        fig.add_trace(go.Scatter(x=grid, y=by_year[y], mode="lines", name=str(y),
                                 line=dict(color=color, width=2.5),
                                 hovertemplate=f"{y}<br>day %{{x}}: %{{y:.2f}} M km²<extra></extra>"))

    # Labels sitting right on the lines, no legend.
    def label(x_doy, y_val, text, color, ax=0, ay=0, anchor="left"):
        fig.add_annotation(x=x_doy, y=y_val, text=text, showarrow=bool(ax or ay), ax=ax, ay=ay,
                           arrowhead=0, arrowwidth=1, arrowcolor=color,
                           font=dict(size=13, color=color), xanchor=anchor, bgcolor="white", borderpad=2)

    imin = int(np.nanargmin(by_year[record]))
    label(imin, by_year[record][imin], f"<b>{record}</b> record low: {sept[record]:.2f} M km²", ORANGE, ax=110, ay=18)
    ilast = int(np.max(np.where(~np.isnan(by_year[latest]))[0]))
    label(ilast, by_year[latest][ilast], f"<b>{latest}</b>", VIOLET, ax=0, ay=0)
    label(200, median[199], "<b>1981–2010 median</b>", INK, ax=70, ay=-40)
    label(120, p90[119], "10th–90th percentile, 1981–2010", MUTED, ax=0, ay=-30)
    label(20, by_year[years[3]][19], f"one line per year, 1979–{latest}", MUTED, ax=60, ay=60)

    month_starts = pd.date_range("2001-01-01", periods=12, freq="MS").dayofyear
    fig.update_layout(**base_layout(margin=dict(l=70, r=90, t=110, b=80)))
    fig.update_xaxes(tickvals=month_starts + 15, ticktext=list("JFMAMJJASOND"), showgrid=False,
                     range=[1, 366], ticklen=0)
    for d in month_starts[1:]:
        fig.add_vline(x=d, line=dict(color=GRID, width=1), layer="below")
    fig.update_yaxes(title_text="Sea ice extent (million km²)", range=[2.5, 17.5], dtick=2.5)

    titles(fig, f"Arctic sea ice, every year from 1979 to {latest}",
           "Daily extent of ocean with at least 15% ice concentration. Grey lines are individual years; "
           "the band spans the 10th–90th percentile of 1981–2010.",
           "Source: NSIDC Sea Ice Index, version 3 (NOAA/NSIDC G02135), via the seaborn-data mirror. Early years measured every second day are interpolated.")
    save(CHART_NUM, fig)
Made with Plotly