
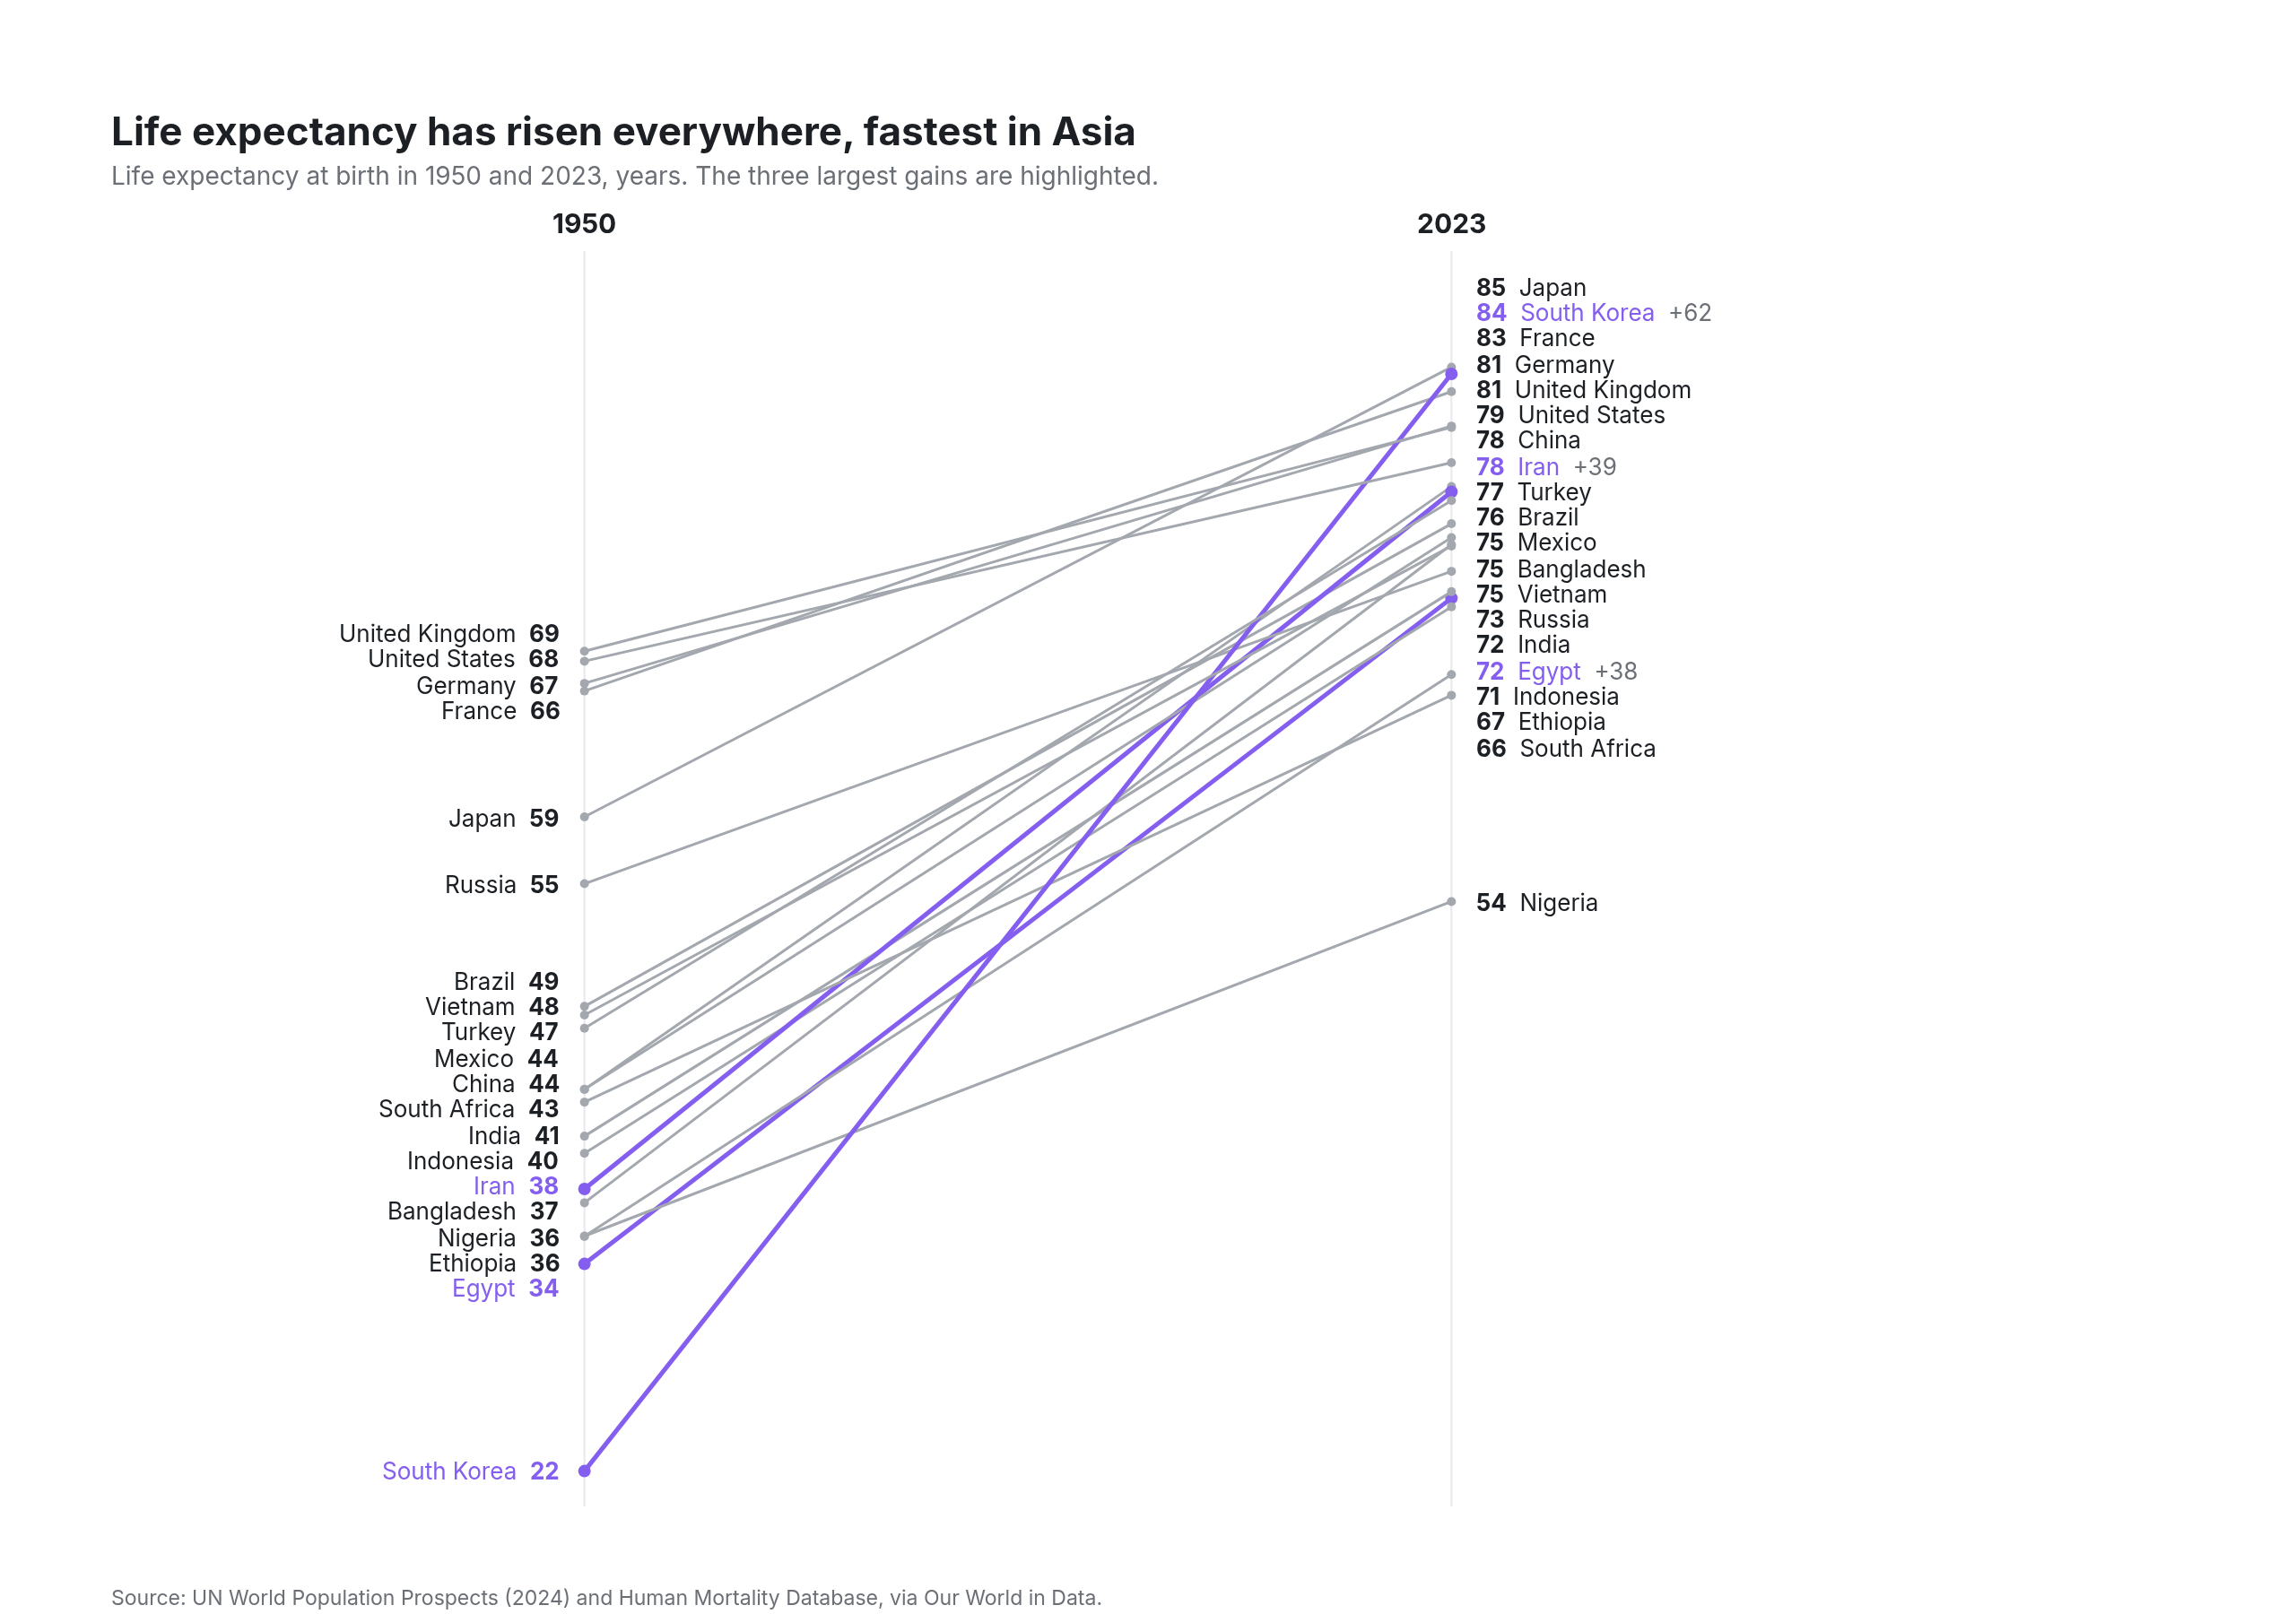
Slope chart
life expectancy in 1950 and 2023, twenty countries
Example from Plotly for highly customizable print-ready data visualization · shared helpers
Python Code
"""Slope chart — life expectancy in 1950 and 2023, twenty countries.

Two columns of values joined by a line, labelled at both ends, with the
labels nudged apart so none overlap. The three largest gains are the only
colour; everything else is set in grey so the eye lands on them first.
"""
from pathlib import Path

from _shared import fetch_csv, save, base_layout, titles, INK, MUTED, FAINT, GRID, VIOLET

import numpy as np
import plotly.graph_objects as go

CHART_NUM = 5
URL = "https://ourworldindata.org/grapher/life-expectancy.csv?csvType=full&useColumnShortNames=true"
COUNTRIES = ["Japan", "South Korea", "China", "India", "Brazil", "Mexico", "Nigeria", "Ethiopia",
             "United States", "United Kingdom", "France", "Germany", "Russia", "Turkey", "Indonesia",
             "Bangladesh", "Egypt", "Iran", "Vietnam", "South Africa"]
Y0, Y1 = 1950, 2023


def spread(values, min_gap):
    """Push label positions apart (in data units) until no two are closer than min_gap."""
    order = np.argsort(values)
    pos = np.array(values, float)
    for _ in range(200):
        moved = False
        for a, b in zip(order[:-1], order[1:]):
            if pos[b] - pos[a] < min_gap:
                shift = (min_gap - (pos[b] - pos[a])) / 2
                pos[a] -= shift
                pos[b] += shift
                moved = True
        if not moved:
            break
    return pos


def generate():
    df = fetch_csv(URL)
    col = [c for c in df.columns if c.startswith("life_expectancy")][0]
    df = df[df["entity"].isin(COUNTRIES) & df["year"].isin([Y0, Y1])]
    wide = df.pivot(index="entity", columns="year", values=col).dropna()
    wide["gain"] = wide[Y1] - wide[Y0]
    top = set(wide.nlargest(3, "gain").index)

    fig = go.Figure()
    left_pos = spread(wide[Y0].to_numpy(), 1.45)
    right_pos = spread(wide[Y1].to_numpy(), 1.45)
    for (name, row), lp, rp in zip(wide.iterrows(), left_pos, right_pos):
        hot = name in top
        color = VIOLET if hot else FAINT
        fig.add_trace(go.Scatter(
            x=[0, 1], y=[row[Y0], row[Y1]], mode="lines+markers", name=name,
            line=dict(color=color, width=2.5 if hot else 1.5),
            marker=dict(size=7 if hot else 5, color=color),
            hovertemplate=f"{name}: %{{y:.1f}} years<extra></extra>",
        ))
        lab = dict(size=13, color=VIOLET if hot else INK)
        fig.add_annotation(x=0, y=lp, text=f"{name}  <b>{row[Y0]:.0f}</b>", xanchor="right", xshift=-12,
                           showarrow=False, font=lab)
        fig.add_annotation(x=1, y=rp, text=f"<b>{row[Y1]:.0f}</b>  {name}" + (f"  <span style='color:{MUTED}'>+{row['gain']:.0f}</span>" if hot else ""),
                           xanchor="left", xshift=12, showarrow=False, font=lab)

    for x, yr in [(0, Y0), (1, Y1)]:
        fig.add_annotation(x=x, y=1.0, yref="paper", text=f"<b>{yr}</b>", showarrow=False,
                           font=dict(size=15, color=INK), yanchor="bottom", yshift=4)

    fig.update_layout(**base_layout(margin=dict(l=60, r=60, t=140, b=60)))
    fig.update_xaxes(visible=False, range=[-0.55, 1.85])
    fig.update_yaxes(visible=False, range=[wide[Y0].min() - 2, right_pos.max() + 2])
    for x in (0, 1):
        fig.add_shape(type="line", x0=x, x1=x, y0=0, y1=1, yref="paper", line=dict(color=GRID, width=1), layer="below")
    titles(fig, "Life expectancy has risen everywhere, fastest in Asia",
           "Life expectancy at birth in 1950 and 2023, years. The three largest gains are highlighted.",
           "Source: UN World Population Prospects (2024) and Human Mortality Database, via Our World in Data.", lift=22)
    save(CHART_NUM, fig, width=1280, height=900)
Made with Plotly