
Small multiples
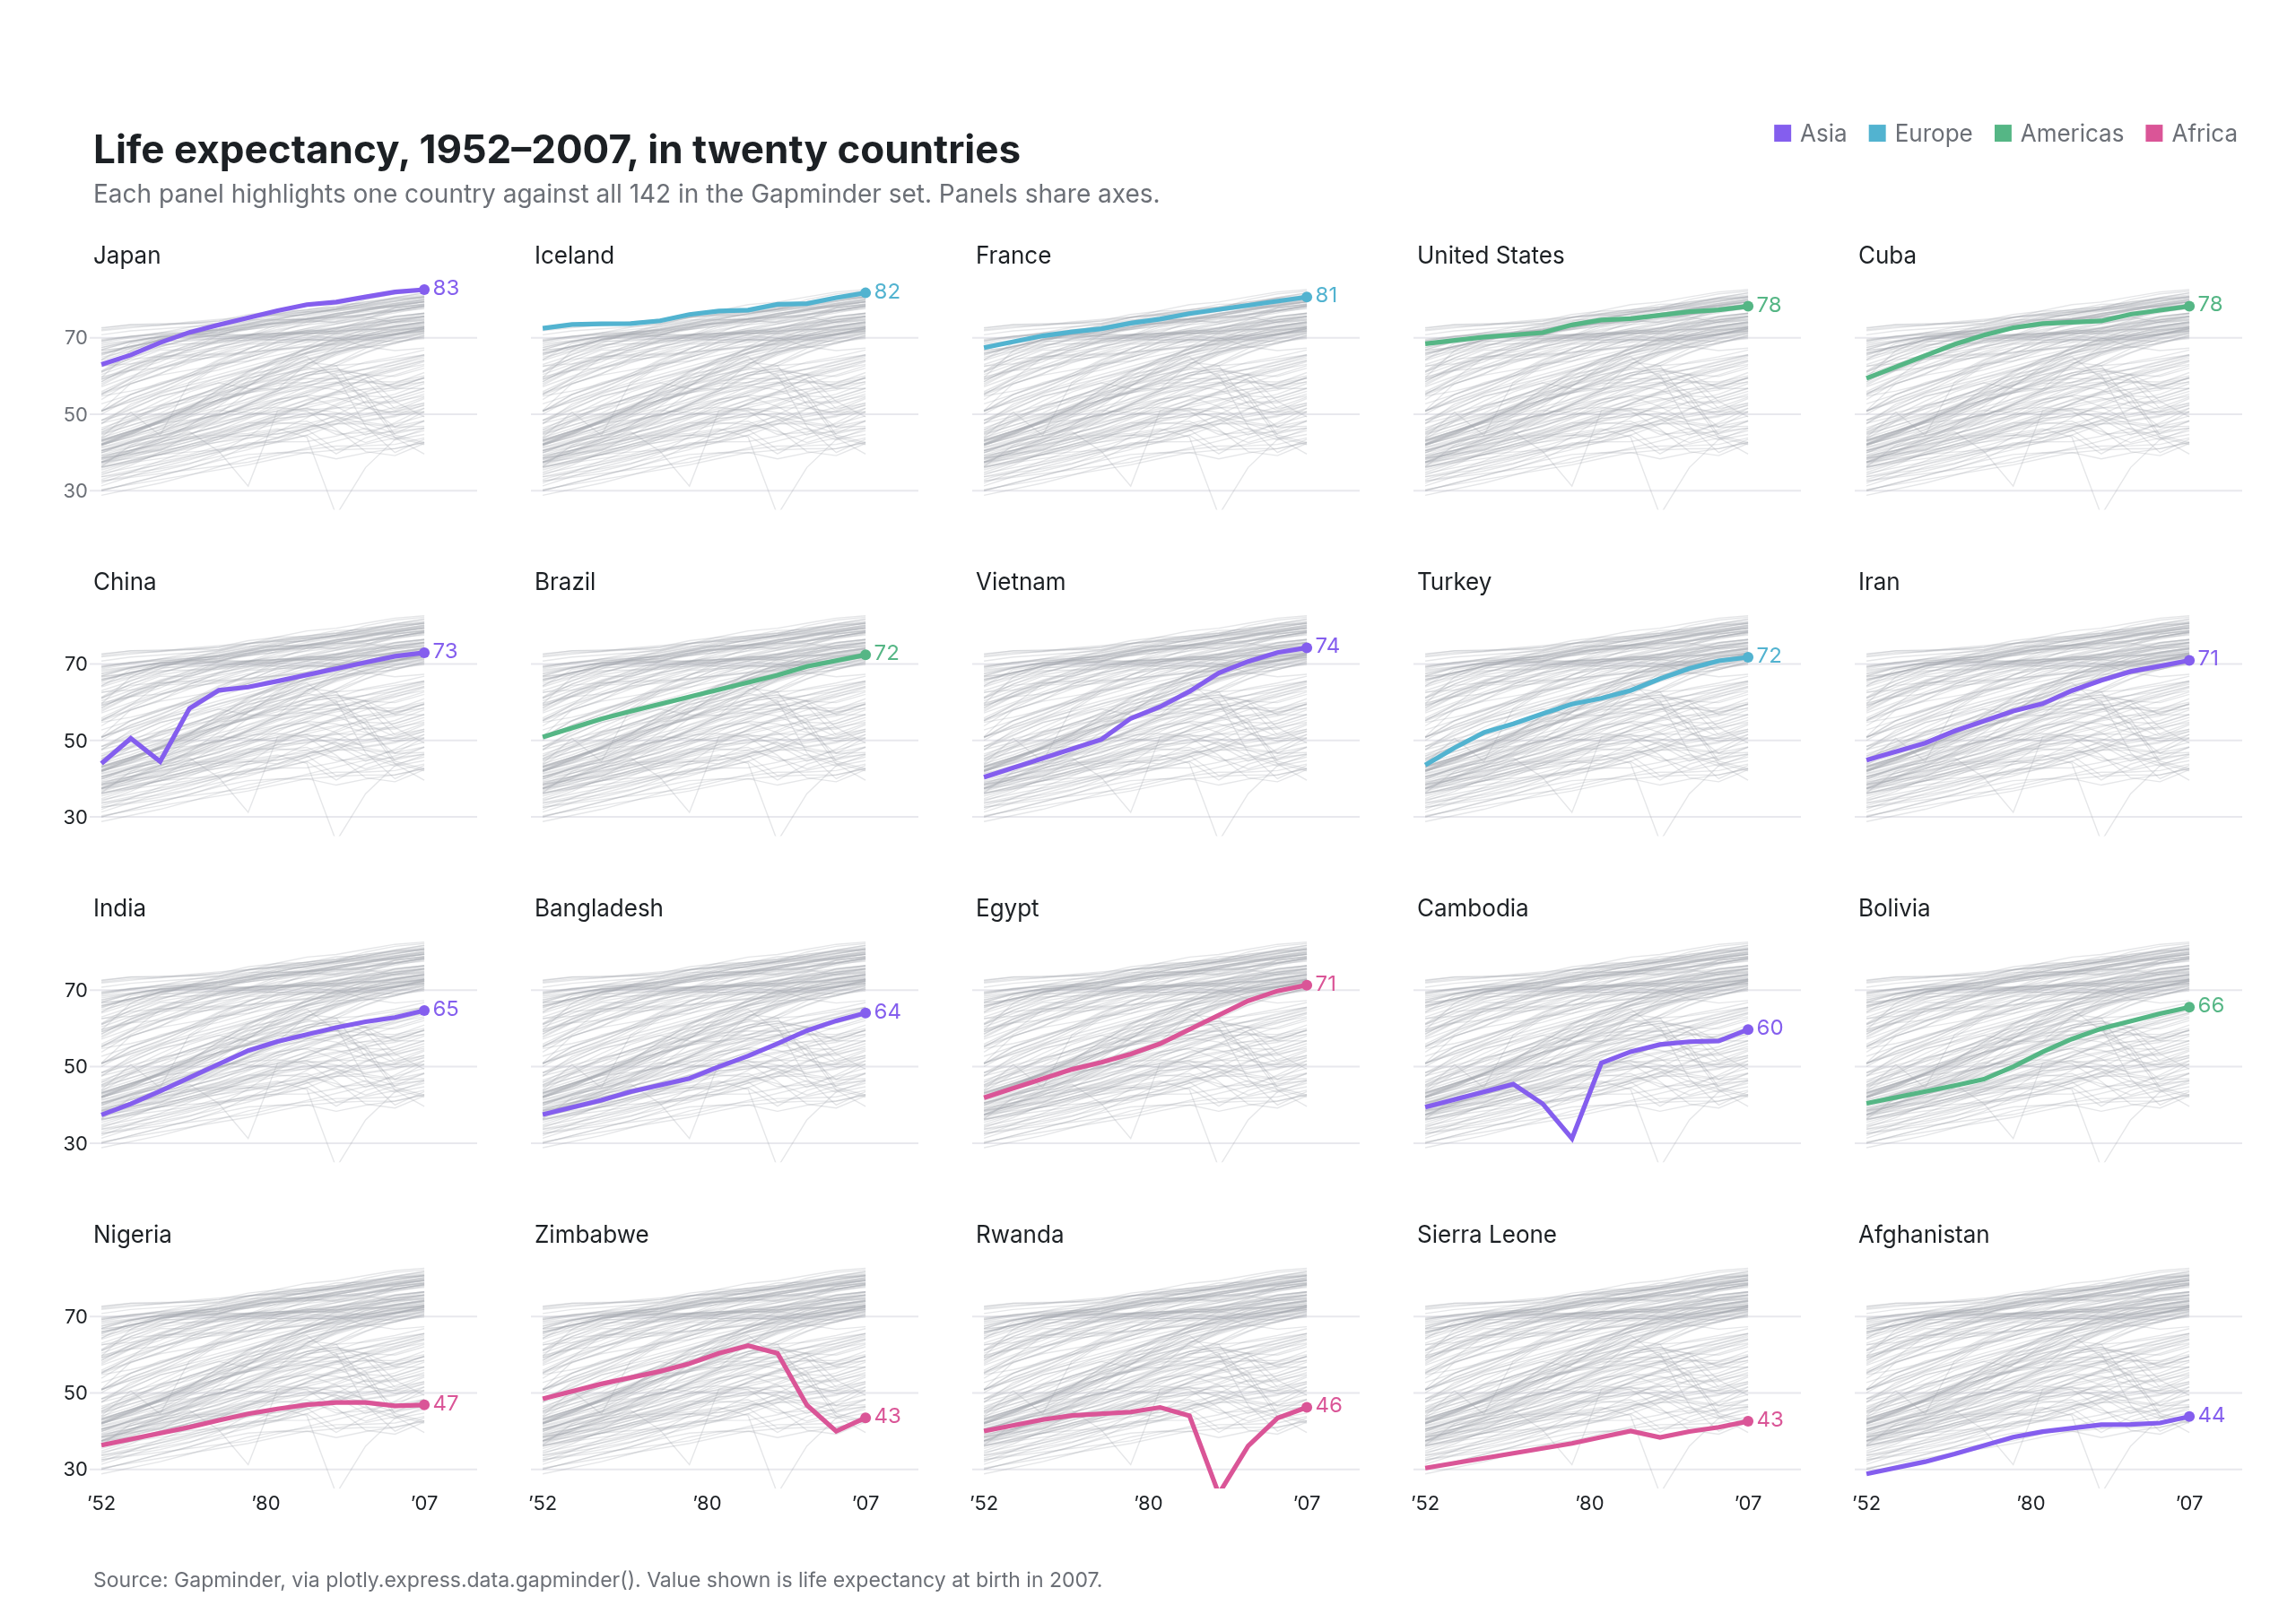
Gapminder life expectancy, 1952–2007, twenty panels
Example from Plotly for highly customizable print-ready data visualization · shared helpers
Python Code
"""Small multiples — Gapminder life expectancy, 1952–2007, twenty panels.

The Financial Times treatment of a panel grid: every other country ghosted
in grey behind each panel's subject, shared axes with ticks only on the
outer edge, and the last value written on the line instead of in a legend.
"""
from pathlib import Path

from _shared import save, base_layout, titles, INK, MUTED, FAINT, GRID, VIOLET, TEAL, GREEN, PINK, ORANGE, hex_to_rgba

import plotly.express as px
import plotly.graph_objects as go
from plotly.subplots import make_subplots

CHART_NUM = 6
COUNTRIES = ["Japan", "Iceland", "France", "United States", "Cuba",
             "China", "Brazil", "Vietnam", "Turkey", "Iran",
             "India", "Bangladesh", "Egypt", "Cambodia", "Bolivia",
             "Nigeria", "Zimbabwe", "Rwanda", "Sierra Leone", "Afghanistan"]
CONTINENT_COLOR = {"Asia": VIOLET, "Europe": TEAL, "Americas": GREEN, "Africa": PINK, "Oceania": ORANGE}
ROWS, COLS = 4, 5


def generate():
    df = px.data.gapminder()
    fig = make_subplots(rows=ROWS, cols=COLS, shared_xaxes=True, shared_yaxes=True,
                        horizontal_spacing=0.025, vertical_spacing=0.07,
                        subplot_titles=COUNTRIES)
    ghost = hex_to_rgba(FAINT, 0.28)
    for i, country in enumerate(COUNTRIES):
        r, c = divmod(i, COLS)
        r, c = r + 1, c + 1
        # All other countries as one None-gapped trace, so the figure stays light.
        gx, gy = [], []
        for other, g in df.groupby("country"):
            if other == country:
                continue
            gx += list(g["year"]) + [None]
            gy += list(g["lifeExp"]) + [None]
        fig.add_trace(go.Scatter(x=gx, y=gy, mode="lines", line=dict(color=ghost, width=0.7),
                                 hoverinfo="skip", showlegend=False), row=r, col=c)
        g = df[df["country"] == country]
        color = CONTINENT_COLOR[g["continent"].iloc[0]]
        fig.add_trace(go.Scatter(x=g["year"], y=g["lifeExp"], mode="lines", line=dict(color=color, width=2.6),
                                 hovertemplate=f"{country} %{{x}}: %{{y:.1f}}<extra></extra>", showlegend=False), row=r, col=c)
        last = g.iloc[-1]
        fig.add_trace(go.Scatter(x=[last["year"]], y=[last["lifeExp"]], mode="markers+text", text=[f"{last['lifeExp']:.0f}"],
                                 textposition="middle right", textfont=dict(size=12, color=color),
                                 marker=dict(size=6, color=color), hoverinfo="skip", showlegend=False), row=r, col=c)

    fig.update_layout(**base_layout(margin=dict(l=50, r=30, t=150, b=70)))
    fig.update_xaxes(range=[1950, 2016], tickvals=[1952, 1980, 2007], ticktext=["’52", "’80", "’07"], showgrid=False, tickfont=dict(size=11))
    fig.update_yaxes(range=[25, 88], tickvals=[30, 50, 70], gridcolor=GRID, tickfont=dict(size=11))
    fig.update_annotations(font=dict(size=13, color=INK), xanchor="left", x=0)
    for a in fig.layout.annotations:  # left-align each subplot title above its own panel
        col = COUNTRIES.index(a.text) % COLS + 1 if a.text in COUNTRIES else None
        if col:
            xa = fig.layout[f"xaxis{'' if col == 1 else col}"]
            a.update(x=xa.domain[0], yshift=-2)

    # Continent key, typed inline instead of a legend box.
    key = "   ".join(f"<span style='color:{c}'>■</span> {k}" for k, c in CONTINENT_COLOR.items() if k != "Oceania")
    fig.add_annotation(x=1, y=1.0, xref="paper", yref="paper", xanchor="right", yanchor="bottom", yshift=66,
                       text=key, showarrow=False, font=dict(size=13, color=MUTED))
    titles(fig, "Life expectancy, 1952–2007, in twenty countries",
           "Each panel highlights one country against all 142 in the Gapminder set. Panels share axes.",
           "Source: Gapminder, via plotly.express.data.gapminder(). Value shown is life expectancy at birth in 2007.", lift=22)
    save(CHART_NUM, fig, width=1280, height=900)
Made with Plotly