
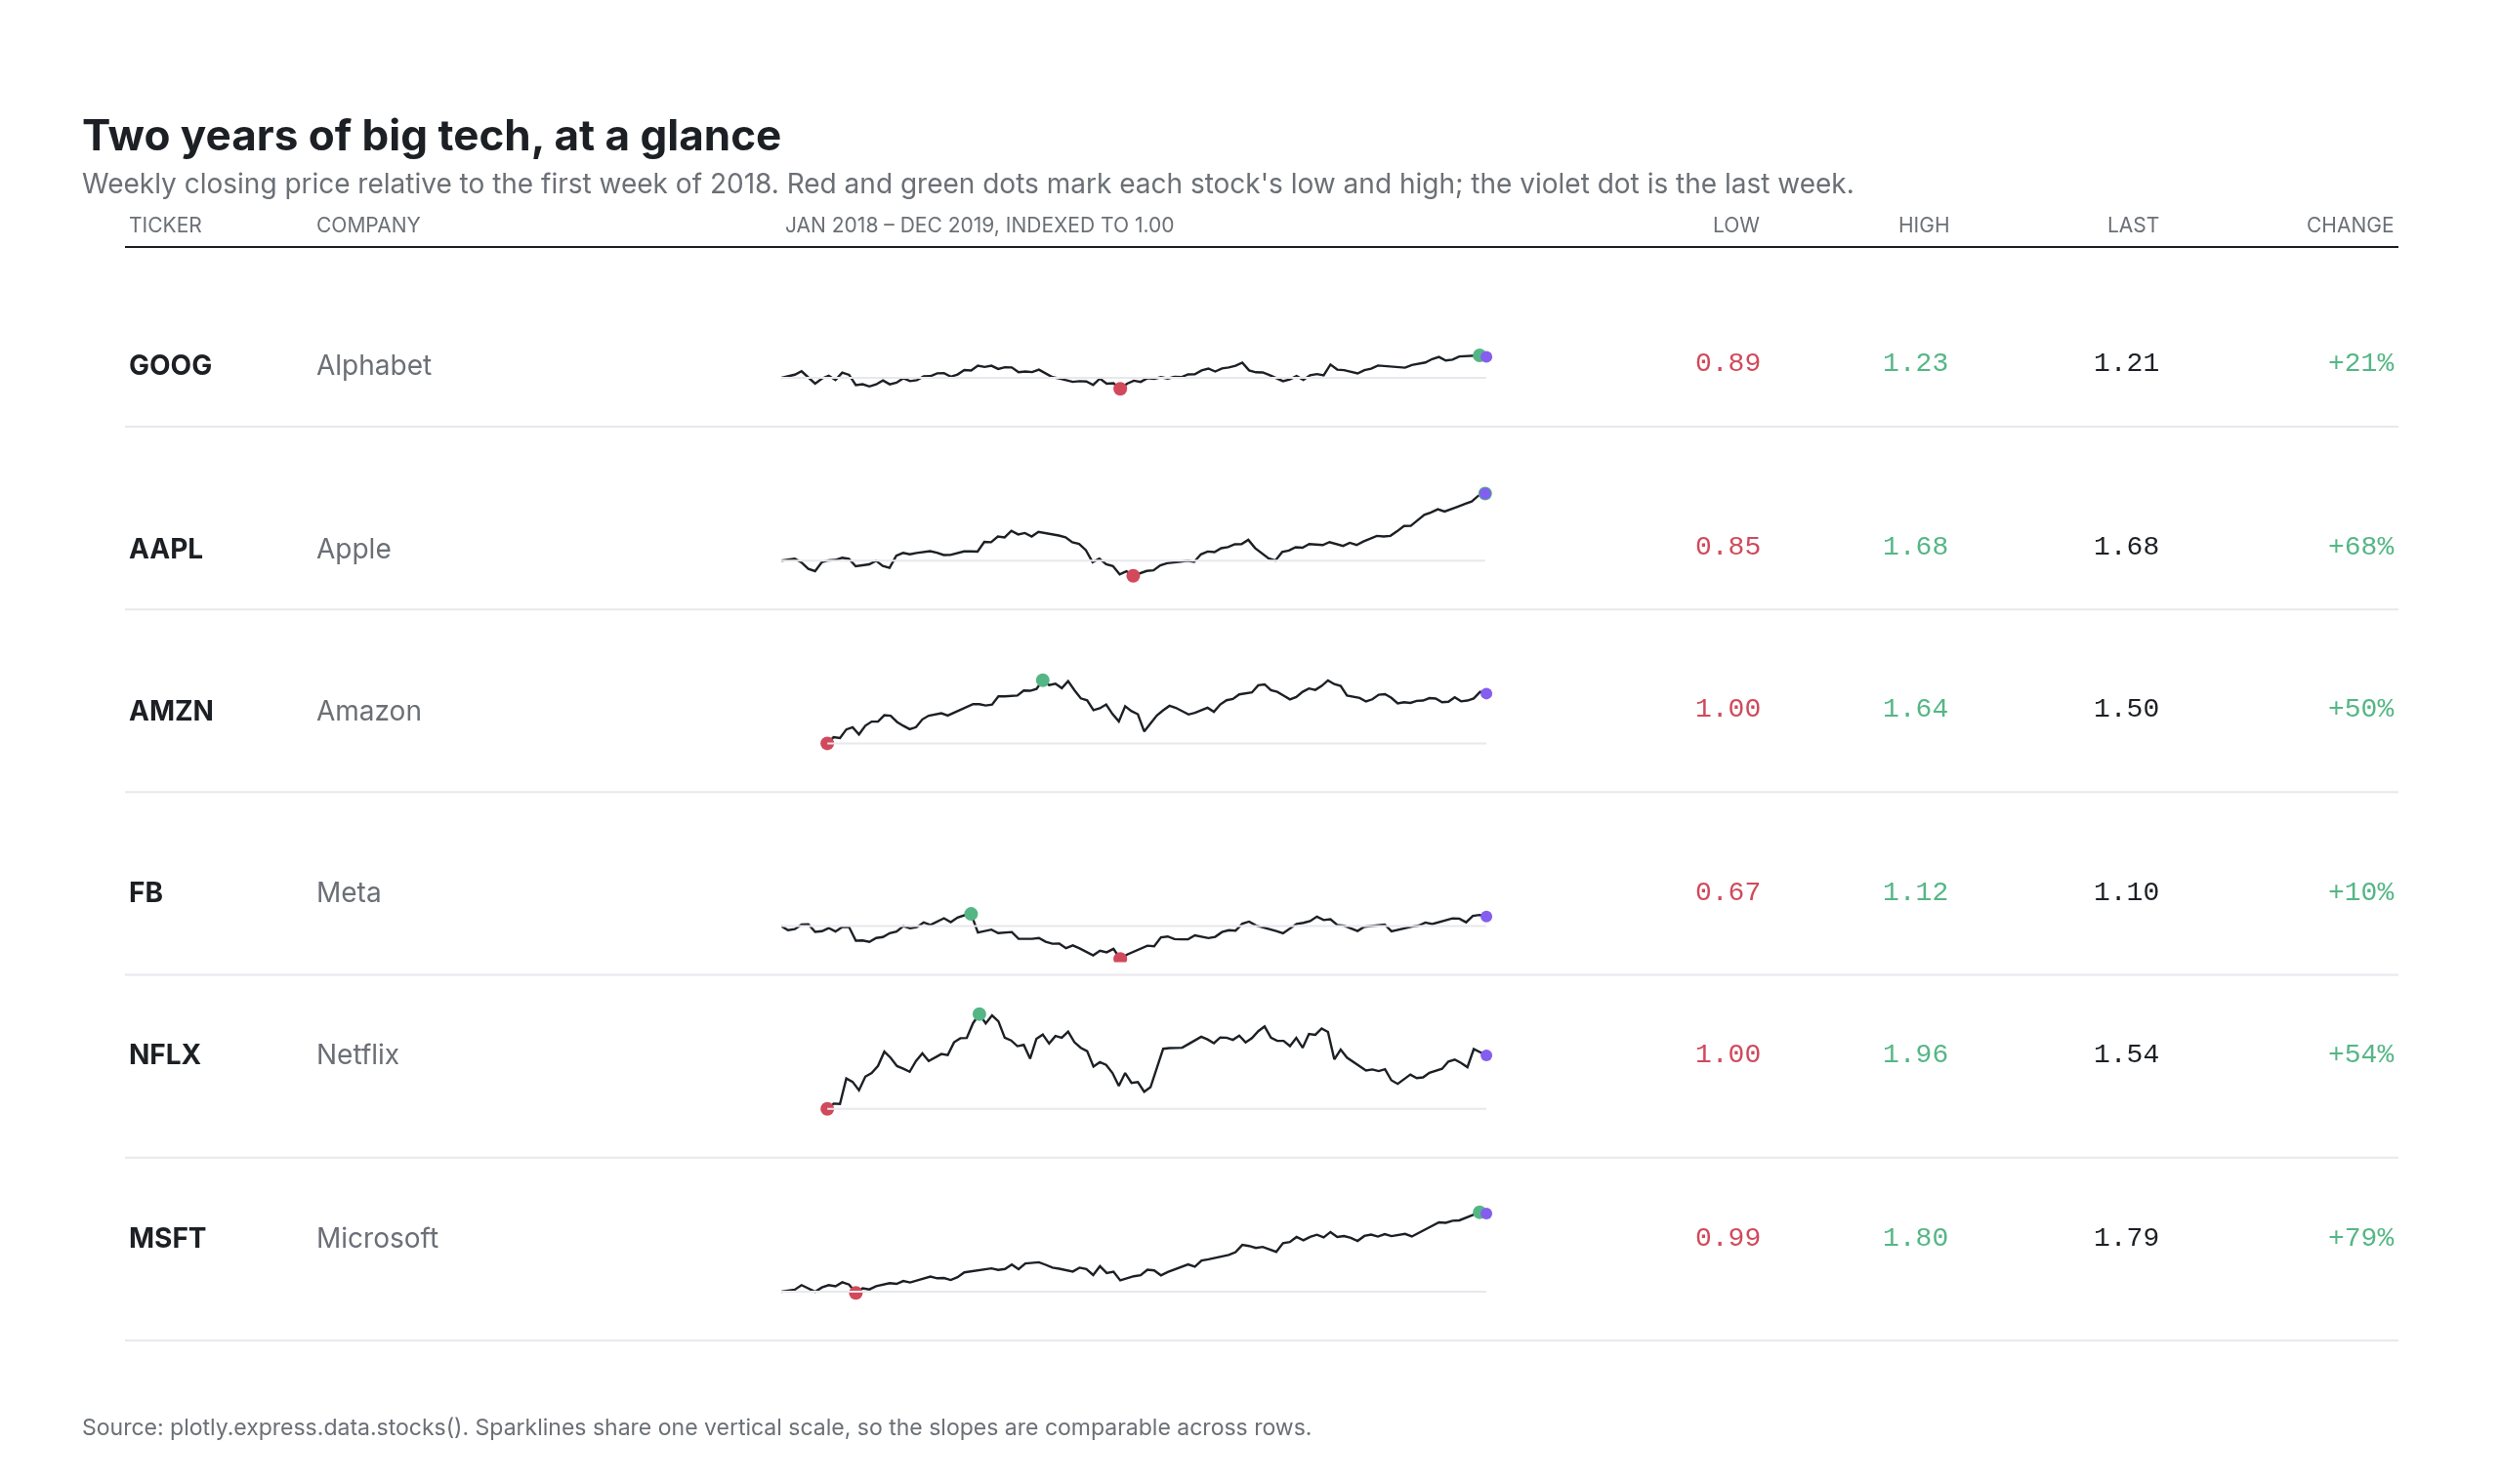
Sparkline table
six stocks over two years, Tufte's word-sized graphics
Example from Plotly for highly customizable print-ready data visualization · shared helpers
Python Code
"""Sparkline table — six stocks over two years, Tufte's word-sized graphics.

A table whose middle column is a chart: one hairline sparkline per row on a
shared scale, the low and high marked, the last value written beside the
line, and the summary numbers set in tabular figures. Rows are subplots;
the text is annotations; there is no axis anywhere.
"""
from pathlib import Path

from _shared import save, base_layout, titles, INK, MUTED, FAINT, GRID, VIOLET, RED, GREEN, MONO

import numpy as np
import pandas as pd
import plotly.express as px
import plotly.graph_objects as go
from plotly.subplots import make_subplots

CHART_NUM = 19
NAMES = {"GOOG": "Alphabet", "AAPL": "Apple", "AMZN": "Amazon", "FB": "Meta", "NFLX": "Netflix", "MSFT": "Microsoft"}


def generate():
    df = px.data.stocks(indexed=True)
    df.index = pd.to_datetime(df.index)
    tickers = list(df.columns)
    n = len(tickers)
    fig = make_subplots(rows=n, cols=1, vertical_spacing=0.04)
    fig.update_layout(**base_layout(margin=dict(l=40, r=40, t=140, b=80)))
    ymin, ymax = df.min().min() * 0.95, df.max().max() * 1.05
    for i, t in enumerate(tickers, start=1):
        s = df[t]
        change = (s.iloc[-1] - 1) * 100
        color = GREEN if change >= 0 else RED
        fig.add_trace(go.Scatter(x=s.index, y=s, mode="lines", line=dict(color=INK, width=1.2), hovertemplate="%{x|%b %Y}: %{y:.2f}<extra>" + t + "</extra>"), row=i, col=1)
        fig.add_trace(go.Scatter(x=[s.idxmin(), s.idxmax()], y=[s.min(), s.max()], mode="markers",
                                 marker=dict(size=7, color=[RED, GREEN]), hoverinfo="skip"), row=i, col=1)
        fig.add_trace(go.Scatter(x=[s.index[-1]], y=[s.iloc[-1]], mode="markers", marker=dict(size=6, color=VIOLET), hoverinfo="skip"), row=i, col=1)
        fig.add_trace(go.Scatter(x=[s.index[0], s.index[-1]], y=[1, 1], mode="lines", line=dict(color=GRID, width=1), hoverinfo="skip"), row=i, col=1)
        fig.update_xaxes(visible=False, domain=[0.30, 0.62], row=i, col=1)
        fig.update_yaxes(visible=False, range=[ymin, ymax], row=i, col=1)
        ya = fig.layout[f"yaxis{'' if i == 1 else i}"]
        ymid = (ya.domain[0] + ya.domain[1]) / 2
        cells = [(0.02, "left", f"<b>{t}</b>", INK, None), (0.10, "left", NAMES[t], MUTED, None),
                 (0.72, "right", f"{s.min():.2f}", RED, MONO), (0.80, "right", f"{s.max():.2f}", GREEN, MONO),
                 (0.89, "right", f"{s.iloc[-1]:.2f}", INK, MONO), (0.99, "right", f"{change:+.0f}%", color, MONO)]
        for x, anchor, text, col, fam in cells:
            fig.add_annotation(x=x, y=ymid, xref="paper", yref="paper", text=text, showarrow=False, xanchor=anchor,
                               font=dict(size=14, color=col, family=fam or None))
        fig.add_shape(type="line", x0=0.02, x1=0.99, y0=ya.domain[0] - 0.012, y1=ya.domain[0] - 0.012, xref="paper", yref="paper",
                      line=dict(color=GRID, width=1))
    # Column headings.
    top = fig.layout.yaxis.domain[1] + 0.03
    for x, anchor, text in [(0.02, "left", "Ticker"), (0.10, "left", "Company"), (0.30, "left", "Jan 2018 – Dec 2019, indexed to 1.00"),
                            (0.72, "right", "Low"), (0.80, "right", "High"), (0.89, "right", "Last"), (0.99, "right", "Change")]:
        fig.add_annotation(x=x, y=top, xref="paper", yref="paper", text=f"<span style='color:{MUTED}'>{text.upper()}</span>", showarrow=False,
                           xanchor=anchor, font=dict(size=10.5), yanchor="bottom")
    fig.add_shape(type="line", x0=0.02, x1=0.99, y0=top - 0.005, y1=top - 0.005, xref="paper", yref="paper", line=dict(color=INK, width=1))
    titles(fig, "Two years of big tech, at a glance",
           "Weekly closing price relative to the first week of 2018. Red and green dots mark each stock's low and high; the violet dot is the last week.",
           "Source: plotly.express.data.stocks(). Sparklines share one vertical scale, so the slopes are comparable across rows.", lift=26)
    save(CHART_NUM, fig, width=1280, height=760)
Made with Plotly