
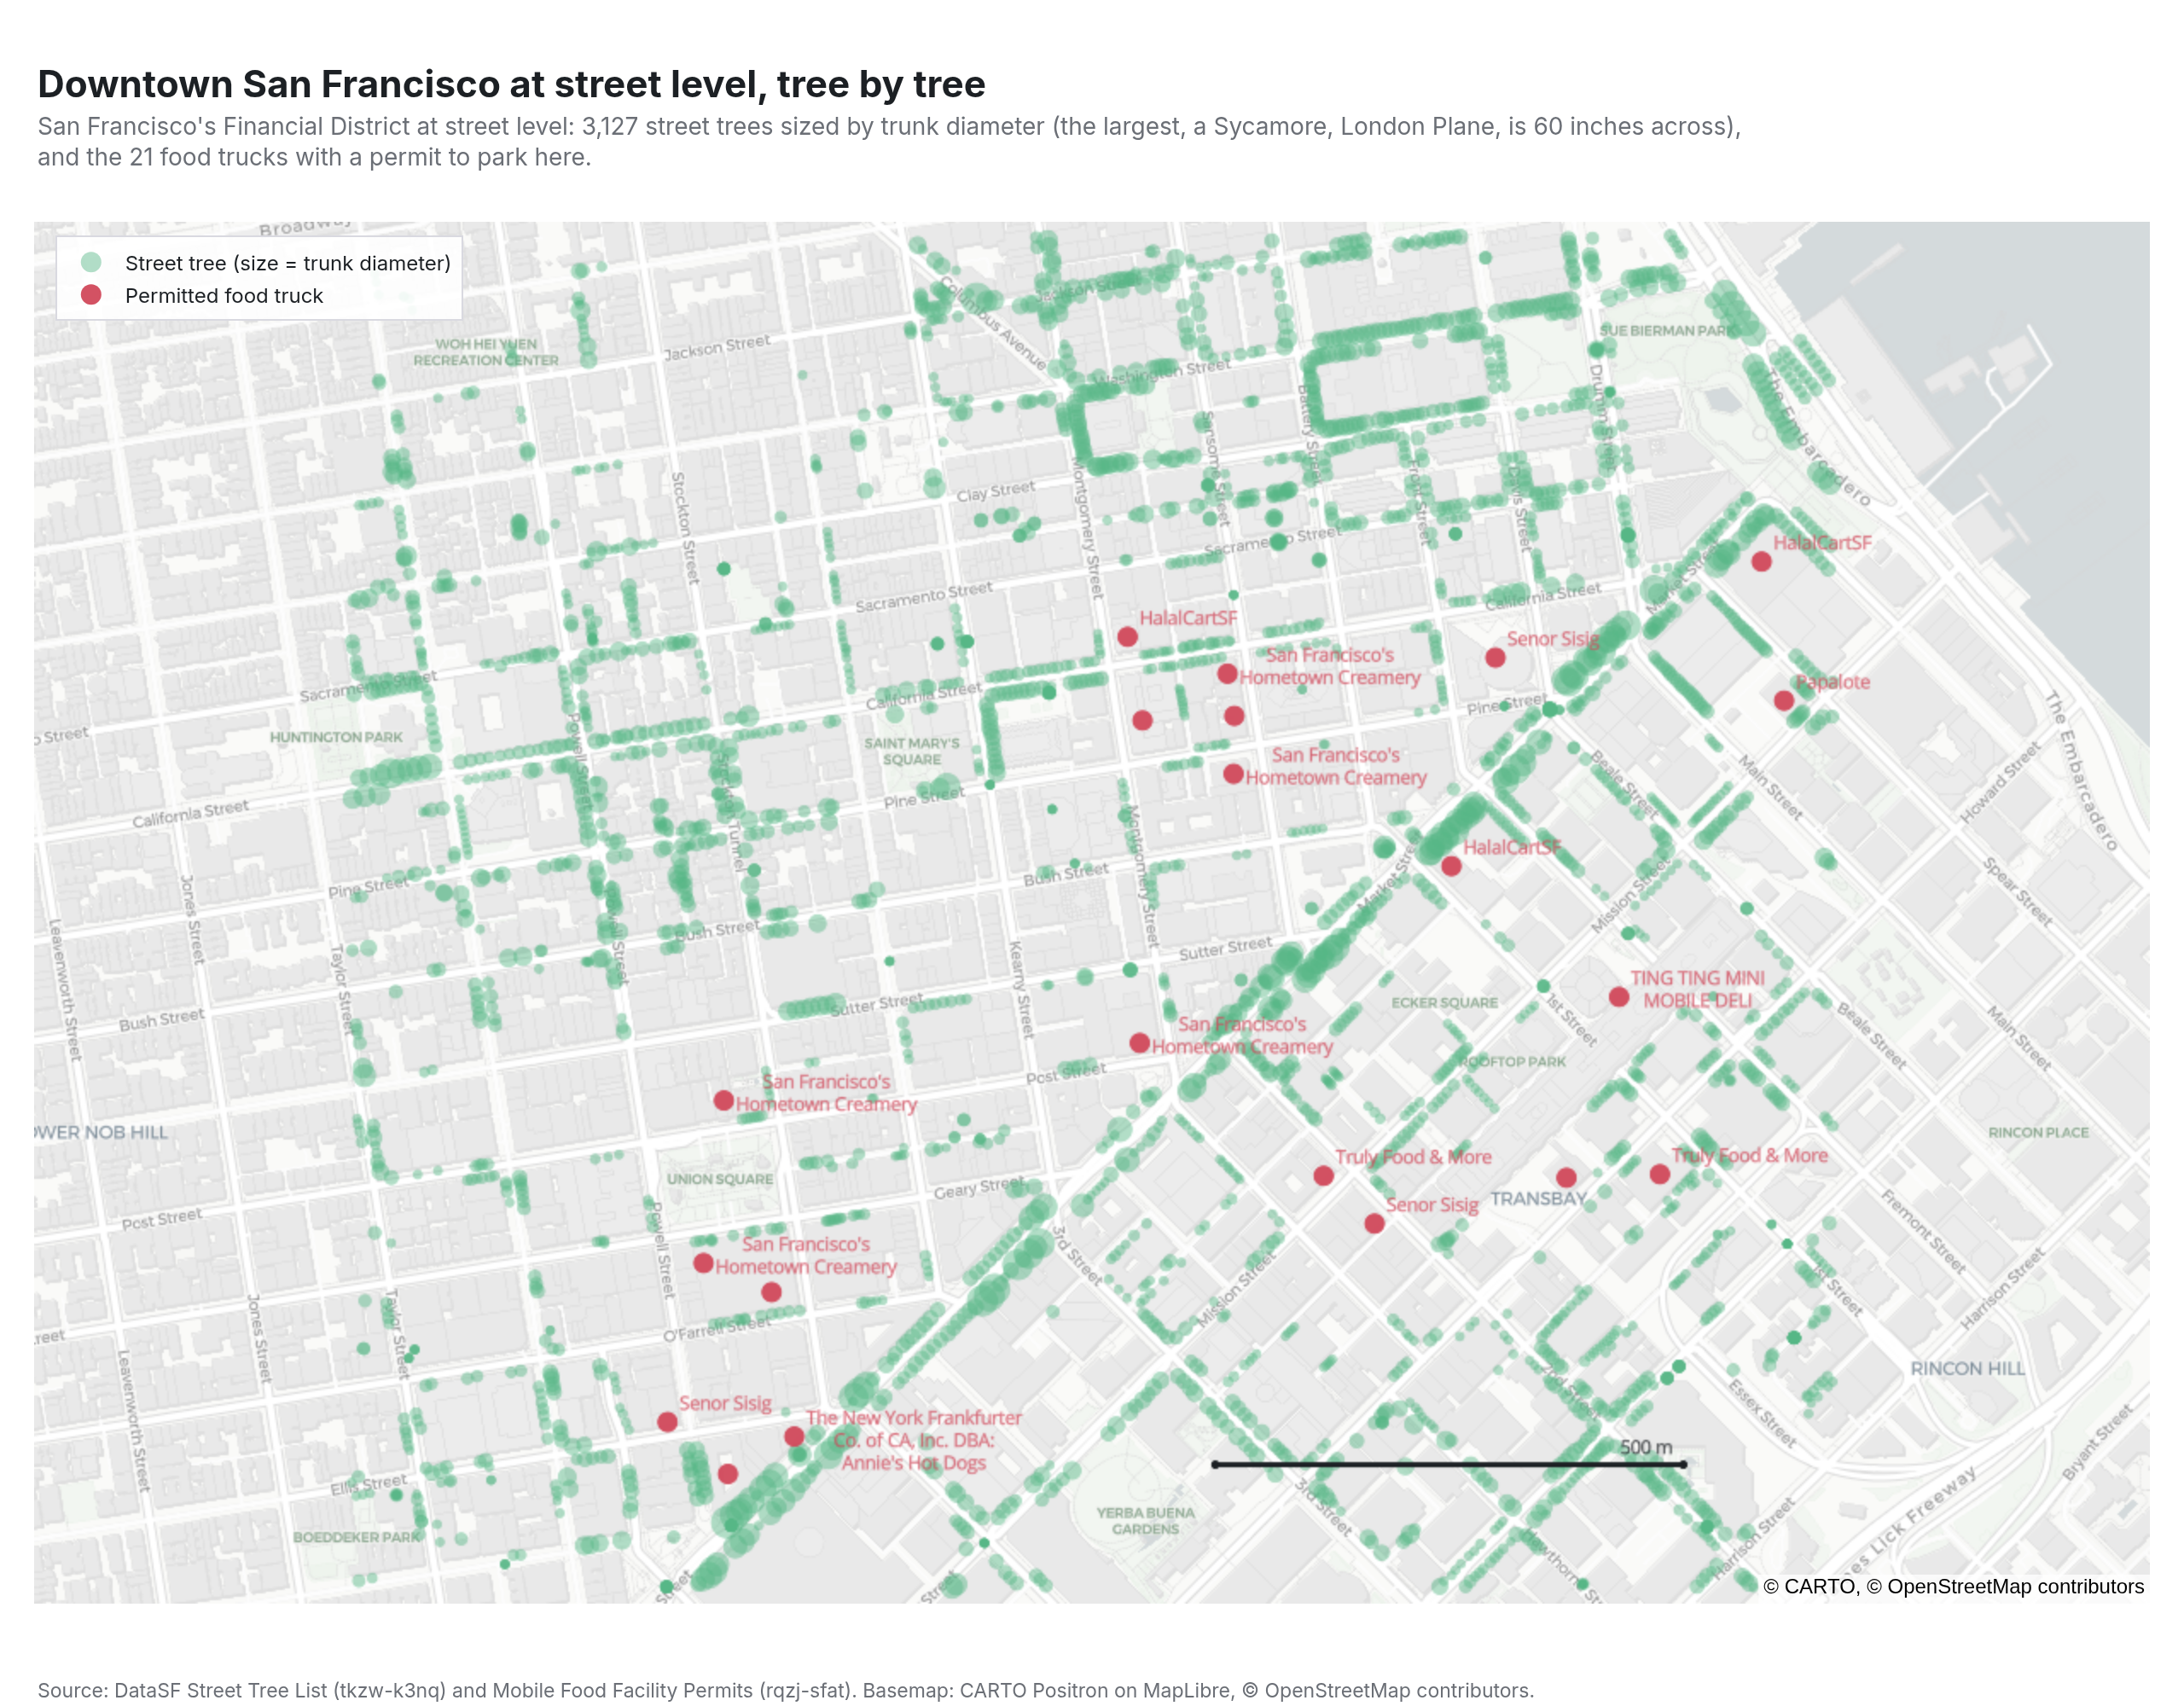
Street-level map
a few downtown blocks: trees by trunk size, food trucks by name
Example from Plotly for highly customizable print-ready data visualization · shared helpers
Python Code
"""Street-level map — a few downtown blocks: trees by trunk size, food trucks by name.

The same MapLibre `map` trace at zoom 15, where the basemap's own street
names do the wayfinding. Every street tree sized by trunk diameter, the
permitted food trucks as labelled markers, a scale bar drawn from two
points a known distance apart, and a light basemap so the ink reads.
"""
from pathlib import Path

from _shared import fetch_csv, save, base_layout, titles, INK, MUTED, GREEN, hex_to_rgba

import numpy as np
import pandas as pd
import plotly.graph_objects as go

CHART_NUM = 31
TREES = "https://data.sfgov.org/api/views/tkzw-k3nq/rows.csv?accessType=DOWNLOAD"
TRUCKS = "https://data.sfgov.org/api/views/rqzj-sfat/rows.csv?accessType=DOWNLOAD"
LAT0, LAT1, LON0, LON1 = 37.784, 37.797, -122.412, -122.394   # the Financial District
TRUCK = "#d1495b"


def generate():
    trees = fetch_csv(TREES, usecols=["species", "latitude", "longitude", "mapdbh"], low_memory=False).dropna(subset=["latitude", "longitude"])
    trees = trees[trees["latitude"].between(LAT0, LAT1) & trees["longitude"].between(LON0, LON1)].copy()
    trees["common"] = trees["species"].str.split(" :: ").str[-1]
    trees["dbh"] = trees["mapdbh"].fillna(trees["mapdbh"].median()).clip(1, 60)
    trucks = fetch_csv(TRUCKS)
    trucks = trucks[(trucks["Status"] == "APPROVED") & trucks["Latitude"].between(LAT0, LAT1) & trucks["Longitude"].between(LON0, LON1)]
    trucks = trucks.drop_duplicates(subset=["Latitude", "Longitude"])

    fig = go.Figure()
    fig.add_trace(go.Scattermap(
        lat=trees["latitude"], lon=trees["longitude"], mode="markers", name="Street tree (size = trunk diameter)",
        marker=dict(size=3 + np.sqrt(trees["dbh"]) * 2.2, color=hex_to_rgba(GREEN, 0.65)),
        customdata=np.c_[trees["common"], trees["dbh"]],
        hovertemplate="%{customdata[0]}<br>trunk %{customdata[1]:.0f} in<extra></extra>",
    ))
    fig.add_trace(go.Scattermap(
        lat=trucks["Latitude"], lon=trucks["Longitude"], mode="markers+text", name="Permitted food truck",
        marker=dict(size=13, color=TRUCK, opacity=0.95),
        text=trucks["Applicant"].str.replace(r" (LLC|Inc\.?)$", "", regex=True), textposition="top right",
        textfont=dict(size=11, color=TRUCK),
        customdata=np.c_[trucks["Address"], trucks["FoodItems"].fillna("").str.slice(0, 60)],
        hovertemplate="<b>%{text}</b><br>%{customdata[0]}<br>%{customdata[1]}<extra></extra>",
    ))
    # Scale bar: 500 m along a parallel is 500 / (111,320 · cos φ) degrees of longitude.
    lat_bar, lon_bar = LAT0 + 0.0012, LON1 - 0.0075
    dlon = 500 / (111_320 * np.cos(np.radians(lat_bar)))
    # (A text layer without markers trips MapLibre's layer builder, so the bar carries its end caps as markers.)
    fig.add_trace(go.Scattermap(lat=[lat_bar, lat_bar], lon=[lon_bar, lon_bar + dlon], mode="lines+markers+text", line=dict(color=INK, width=3),
                                marker=dict(size=6, color=INK), text=["", "500 m"], textposition="top left",
                                textfont=dict(size=11, color=INK), hoverinfo="skip", showlegend=False))

    fig.update_layout(**base_layout(margin=dict(l=20, r=20, t=130, b=60), showlegend=True,
                                    legend=dict(x=0.01, y=0.99, xanchor="left", yanchor="top", bgcolor="rgba(255,255,255,0.9)",
                                                font=dict(size=12), itemsizing="constant", bordercolor="#d9d9e0", borderwidth=1)))
    fig.update_layout(map=dict(style="carto-positron", center=dict(lat=(LAT0 + LAT1) / 2, lon=(LON0 + LON1) / 2), zoom=15.05),
                      map_domain=dict(x=[0, 1], y=[0, 1]))
    big = trees.nlargest(1, "dbh").iloc[0]
    titles(fig, "Downtown San Francisco at street level, tree by tree",
           f"San Francisco's Financial District at street level: {len(trees):,} street trees sized by trunk diameter (the largest, a {big['common']}, is {big['dbh']:.0f} inches across),<br>"
           f"and the {len(trucks)} food trucks with a permit to park here.",
           "Source: DataSF Street Tree List (tkzw-k3nq) and Mobile Food Facility Permits (rqzj-sfat). Basemap: CARTO Positron on MapLibre, © OpenStreetMap contributors.", lift=18)
    save(CHART_NUM, fig, width=1280, height=1000)
Made with Plotly