
Terrain surface
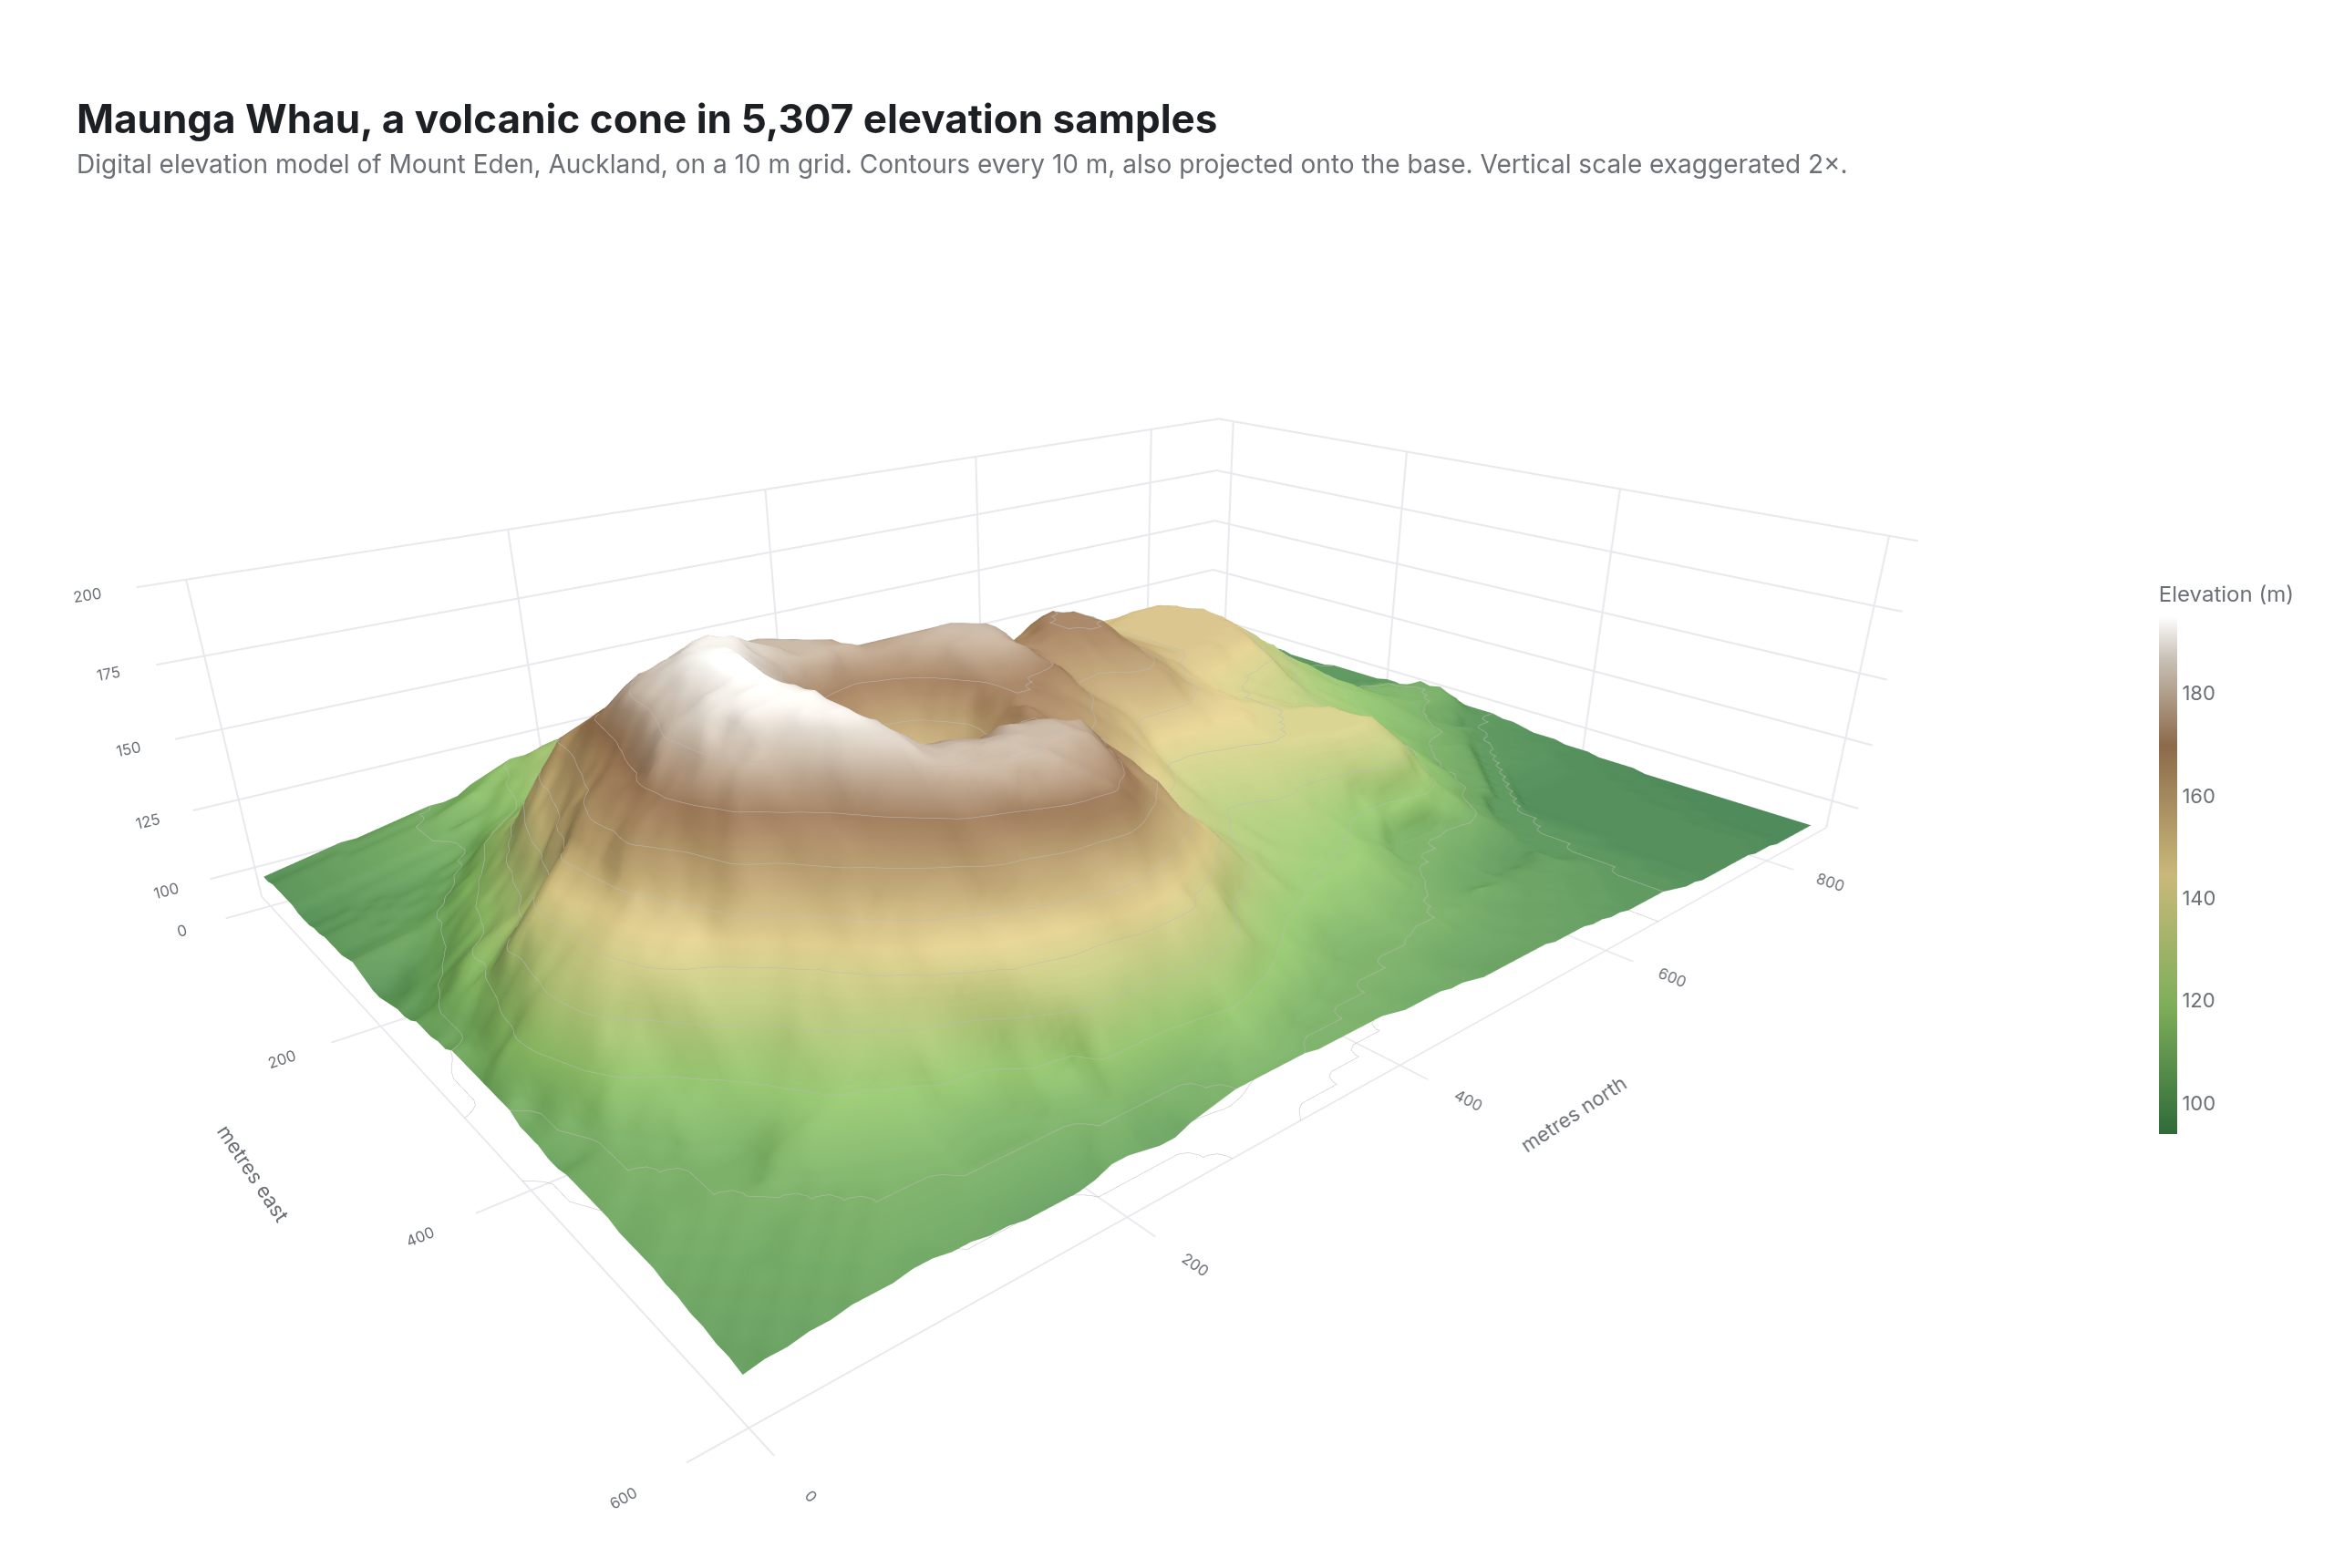
Maunga Whau (Mount Eden), Auckland, from a 10 m elevation grid
Example from Plotly for highly customizable print-ready data visualization · shared helpers
Python Code
"""Terrain surface — Maunga Whau (Mount Eden), Auckland, from a 10 m elevation grid.

A 3D surface lit like a relief model: a terrain colour ramp, Phong lighting
from the north-west, contour lines on the surface and projected onto the
floor, the axes reduced to a scale bar, and a camera set low enough that
the crater reads as a crater. The vertical scale is exaggerated and says so.
"""
from pathlib import Path

from _shared import fetch_csv, save, base_layout, titles, INK, MUTED, GRID

import numpy as np
import plotly.graph_objects as go

CHART_NUM = 25
URL = "https://vincentarelbundock.github.io/Rdatasets/csv/datasets/volcano.csv"
TERRAIN = [[0.0, "#2f6b3a"], [0.25, "#7fae5a"], [0.5, "#c9b87a"], [0.75, "#8c6a4a"], [0.92, "#c9c2b8"], [1.0, "#ffffff"]]
SPACING = 10   # metres between grid points
EXAGGERATION = 2.0


def generate():
    z = fetch_csv(URL).drop(columns="rownames").to_numpy(float)   # 87 rows × 61 columns, metres
    ny, nx = z.shape
    x = np.arange(nx) * SPACING
    y = np.arange(ny) * SPACING
    fig = go.Figure(go.Surface(
        x=x, y=y, z=z, colorscale=TERRAIN, cmin=z.min(), cmax=z.max(),
        lighting=dict(ambient=0.45, diffuse=0.85, specular=0.15, roughness=0.6, fresnel=0.1),
        lightposition=dict(x=-800, y=1200, z=800),
        contours=dict(z=dict(show=True, start=100, end=190, size=10, color="rgba(20,20,20,0.35)", width=1.5,
                             project=dict(z=True), usecolormap=False)),
        colorbar=dict(title=dict(text="Elevation (m)", side="top", font=dict(size=12, color=MUTED)),
                      x=0.97, y=0.5, len=0.45, thickness=10, tickfont=dict(size=11, color=MUTED), outlinewidth=0),
        hovertemplate="%{x:.0f} m E, %{y:.0f} m N<br>%{z:.0f} m<extra></extra>",
    ))
    axis = dict(showbackground=False, showgrid=True, gridcolor=GRID, zeroline=False, showline=False,
                tickfont=dict(size=10, color=MUTED), title=dict(font=dict(size=11, color=MUTED)), ticks="")
    fig.update_layout(**base_layout(margin=dict(l=40, r=40, t=110, b=30)))
    fig.update_layout(scene=dict(
        xaxis=dict(axis, title_text="metres east", dtick=200),
        yaxis=dict(axis, title_text="metres north", dtick=200),
        zaxis=dict(axis, title_text="m", range=[z.min() - 5, z.max() + 5], dtick=25),
        aspectmode="manual",
        aspectratio=dict(x=1, y=ny / nx, z=(z.max() - z.min()) / (nx * SPACING) * EXAGGERATION * 1.0),
        camera=dict(eye=dict(x=1.15, y=-1.0, z=0.55), up=dict(x=0, y=0, z=1), center=dict(x=0, y=0, z=-0.15)),
        domain=dict(x=[0, 0.94], y=[0.0, 1.0]),
    ))
    titles(fig, "Maunga Whau, a volcanic cone in 5,307 elevation samples",
           f"Digital elevation model of Mount Eden, Auckland, on a 10 m grid. Contours every 10 m, also projected onto the base. "
           f"Vertical scale exaggerated {EXAGGERATION:.0f}×.",
           "Source: R's datasets::volcano (Ross Ihaka, from a topographic map of the Auckland volcanic field). Rendered with Phong lighting from the north-west.")
    save(CHART_NUM, fig, width=1280, height=860)
Made with Plotly