
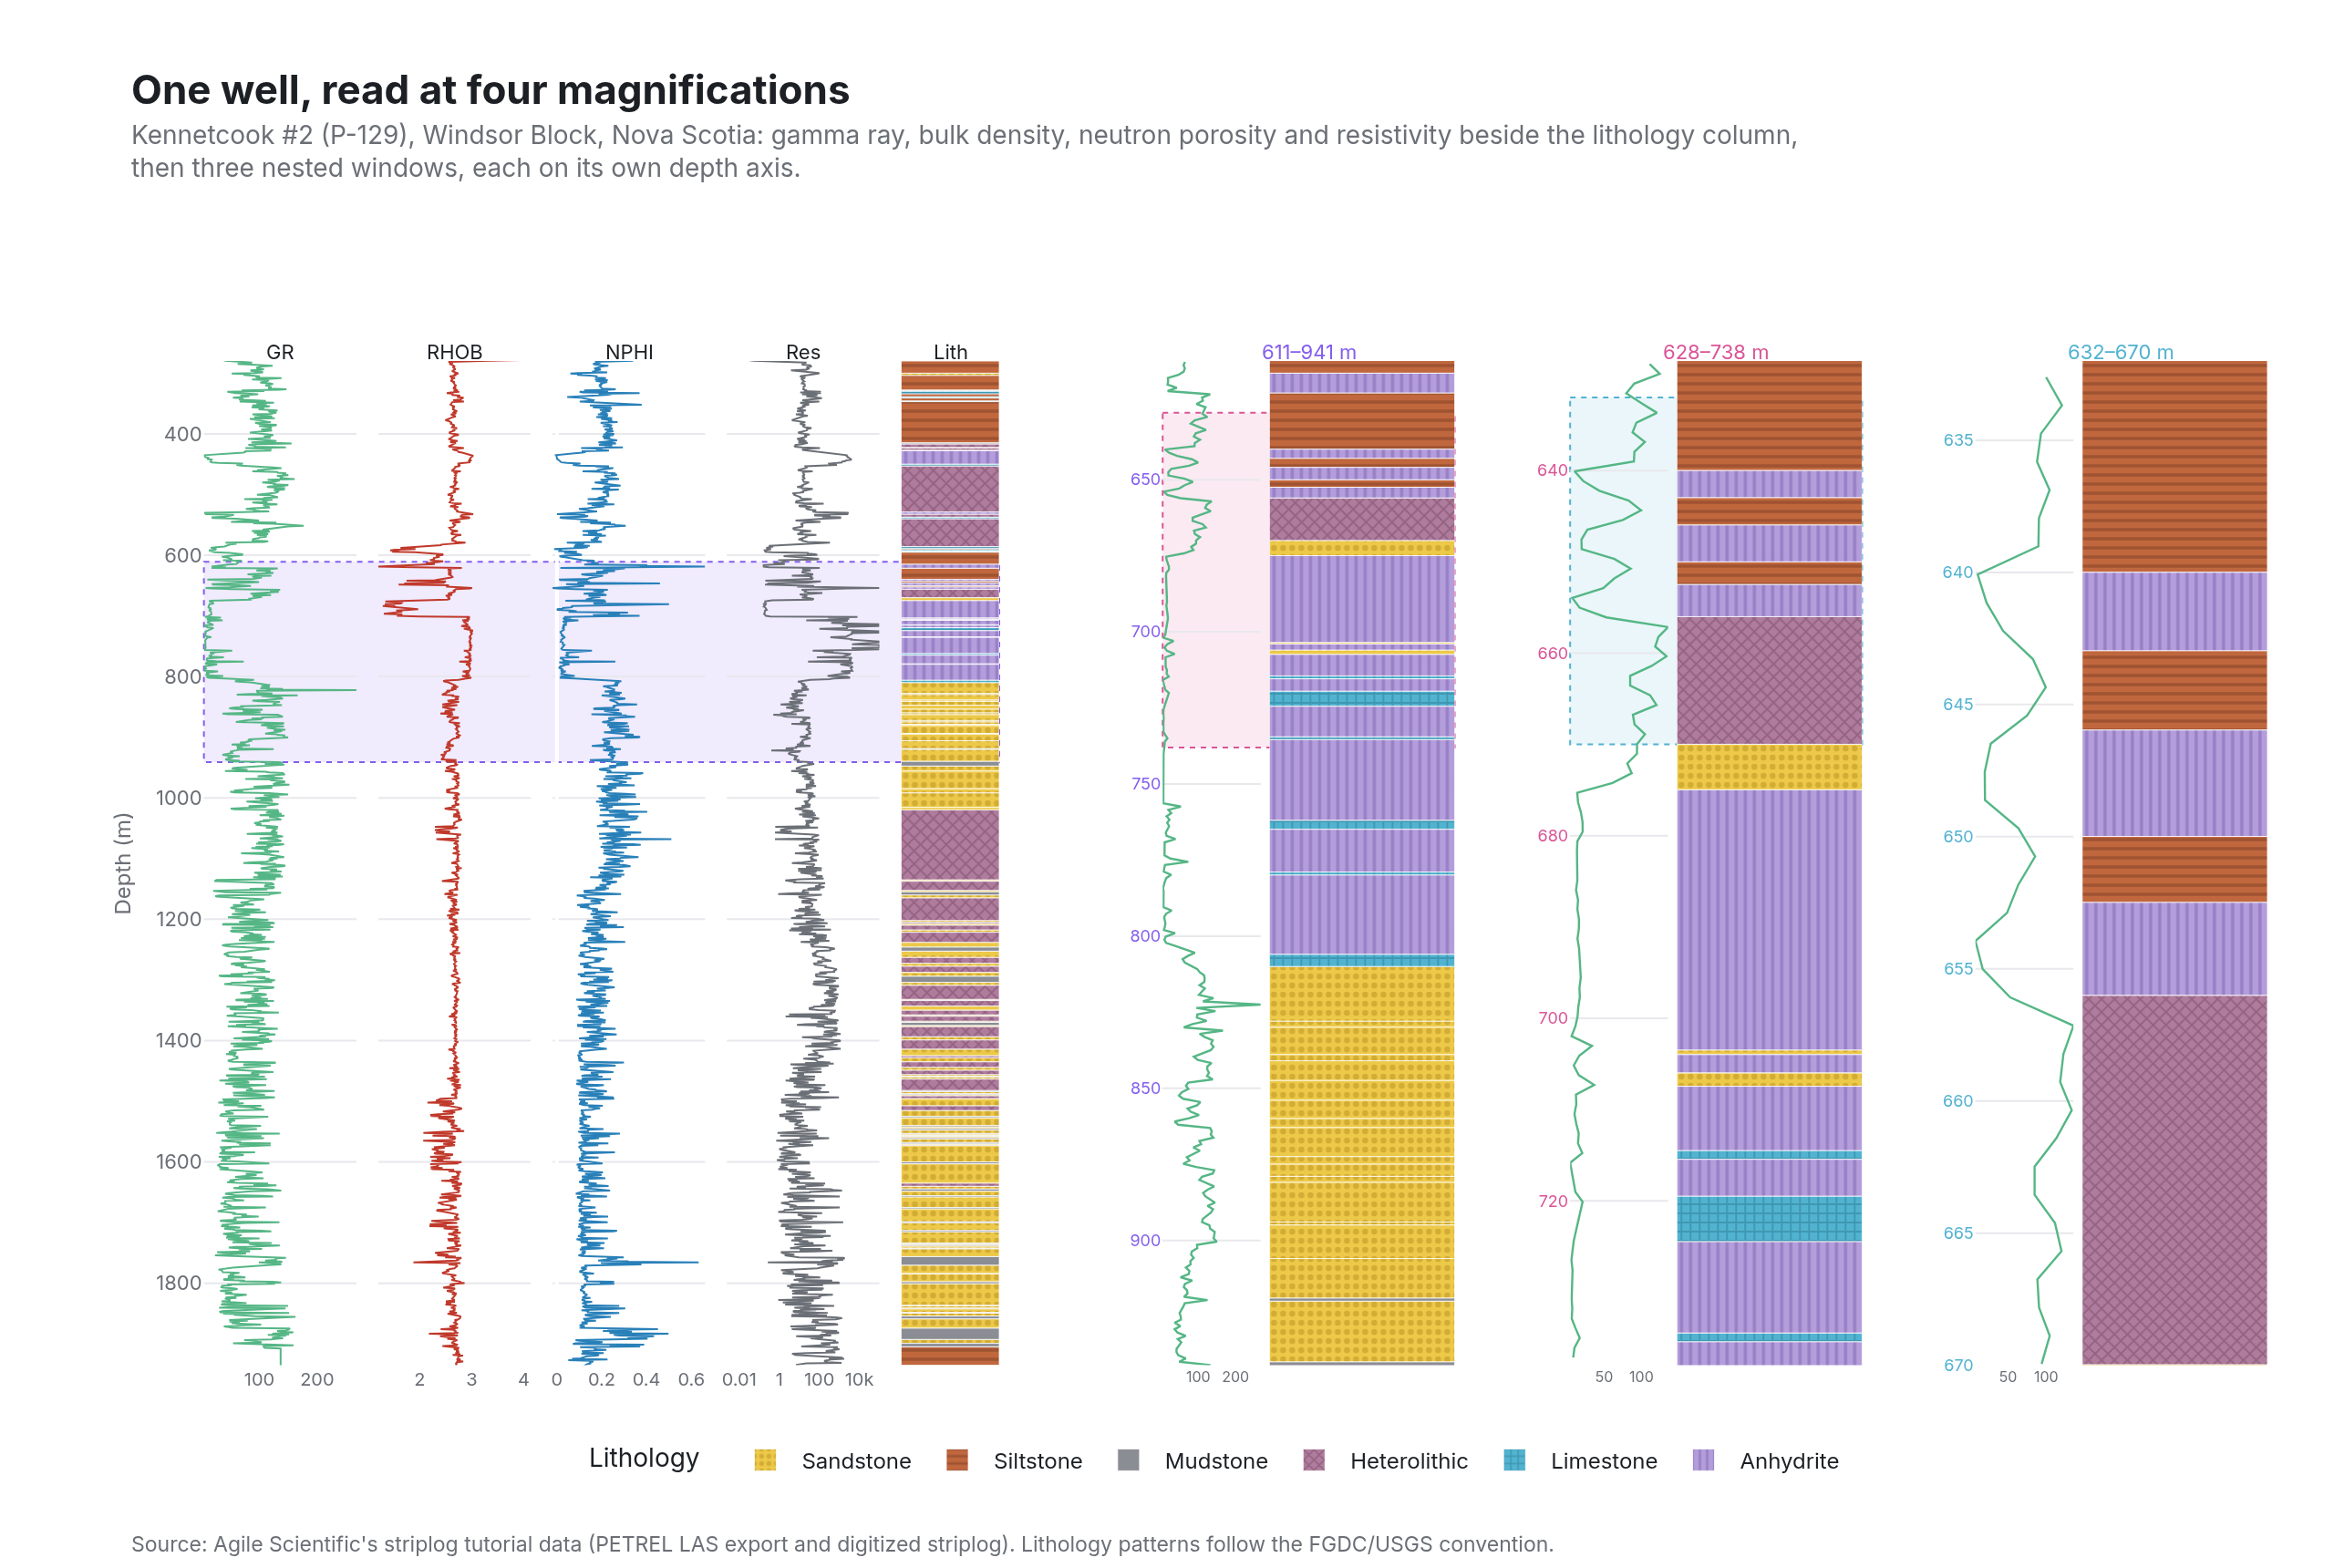
a composite well log with a telescoping zoom cascade
Borehole striplog
Example from Plotly for highly customizable print-ready data visualization · shared helpers
Python Code
"""Borehole striplog — a composite well log with a telescoping zoom cascade.

Ported from the compendium of canonical charts. Four wireline curves beside
a lithology column patterned in the USGS convention, all hung on one
reversed depth axis, then three sub-views that each magnify a window inside
the previous one on their own depth axes: eleven x axes and four y axes in
a single figure, every domain placed by hand.

Data: the Kennetcook #2 (P-129) well, Windsor Block, Nova Scotia, the
teaching well shipped with Agile's striplog library. The multi-axis
correlation lines (plotly.js 3.4+ shape refs) live only in the figure JSON;
the static render shows the tracks and highlight bands.
"""
import json
import os
import tempfile
from pathlib import Path

from _shared import fetch_text, save, base_layout, titles, OUT, INK, MUTED, GRID, GREEN, TEAL, PINK, VIOLET, hex_to_rgba

import numpy as np
import pandas as pd
import plotly.graph_objects as go

CHART_NUM = 28
BASE = "https://raw.githubusercontent.com/agilescientific/striplog/main/docs/tutorial/"
LAS_URL = BASE + "P-129_out.LAS"
LITH_URL = BASE + "P-129_striplog_from_image.las"
NULL_VAL = -999.25
DECIMATE = 1600
ZOOM_WIDTHS = (330.0, 110.0, 38.0)
ZOOM_ACCENTS = [VIOLET, PINK, TEAL]

# Lithology → (fill, plotly pattern shape, pattern line colour), after the FGDC/USGS convention.
LITHOLOGY = {
    "Siltstone":    ("#c0673e", "-", "#7d3f23"),
    "Sandstone":    ("#edc949", ".", "#b8901f"),
    "Limestone":    ("#52b3d0", "+", "#2c7d96"),
    "Mudstone":     ("#8a8d93", "",  "#5a5d63"),
    "Heterolithic": ("#b07c9e", "x", "#754a63"),
    "Anhydrite":    ("#b39ddb", "|", "#7e63b0"),
}
LEGEND_ORDER = ["Sandstone", "Siltstone", "Mudstone", "Heterolithic", "Limestone", "Anhydrite"]


def classify(desc: str) -> str:
    d = desc.lower()
    for key in ("anhydrite", "limestone", "heterolithic", "mudstone", "sandstone"):
        if key in d:
            return key.capitalize()
    return "Siltstone"


def load_curves() -> pd.DataFrame:
    import lasio
    with tempfile.NamedTemporaryFile(suffix=".las", delete=False, mode="w") as f:
        f.write(fetch_text(LAS_URL))
        tmp = f.name
    try:
        df = lasio.read(tmp, engine="normal").df().reset_index()
    finally:
        os.unlink(tmp)
    df.columns = [c.strip().upper() for c in df.columns]
    return df.replace(NULL_VAL, np.nan)


def load_lithology() -> pd.DataFrame:
    lines = fetch_text(LITH_URL).replace("\r", "\n").split("\n")
    start = next(i for i, l in enumerate(lines) if l.startswith("~Lithology_Data"))
    rows = []
    for line in lines[start + 1:]:
        line = line.strip()
        if not line or line[0] in "~#":
            continue
        top, base, desc = (x.strip() for x in line.split(",", 2))
        rows.append((float(top), float(base), desc.strip().strip('"')))
    return pd.DataFrame(rows, columns=["top", "base", "description"])


def pick_nested(lith, d_top, d_base, widths=ZOOM_WIDTHS):
    """Nested windows, each chosen inside the previous for the most lithologic variety."""
    windows, lo, hi = [], d_top, d_base
    for w in widths:
        best, best_score = (lo, lo + w), (-1, -1)
        step = max(4.0, (hi - lo - w) / 40)
        for start in np.arange(lo, hi - w + 0.1, step):
            sel = lith[(lith["base"] > start) & (lith["top"] < start + w)]
            score = (sel["litho"].nunique(), len(sel))
            if score > best_score:
                best_score, best = score, (round(start), round(start + w))
        windows.append(best)
        lo, hi = best
    return windows


def generate():
    cv = load_curves()
    dcol = next(c for c in cv.columns if c in ("DEPT", "DEPTH", "MD"))
    cv = cv.iloc[::max(1, len(cv) // DECIMATE)].copy()
    lith = load_lithology()
    lith["litho"] = lith["description"].map(classify)
    depth = cv[dcol]
    d_top, d_base = 280.0, 1935.0
    windows = pick_nested(lith, d_top, d_base)

    def col(name):
        return cv[name] if name in cv.columns else pd.Series(np.nan, index=cv.index)

    fig = go.Figure()

    def curve(values, axis, color, name):
        fig.add_trace(go.Scatter(x=values, y=depth, mode="lines", line=dict(color=color, width=1.0), name=name,
                                 xaxis=axis, yaxis="y", showlegend=False,
                                 hovertemplate="%{x:.2f}<br>%{y:.1f} m<extra>" + name + "</extra>"))

    curve(col("GR"), "x", GREEN, "GR (gAPI)")
    curve(col("RHOB"), "x2", "#c0392b", "RHOB (g/cc)")
    curve(col("NPHI_SAN"), "x3", "#2980b9", "NPHI (v/v)")
    curve(col("RT_HRLT"), "x4", MUTED, "Resistivity (Ω·m)")

    def lith_bars(xaxis, yaxis, showlegend):
        for name in LEGEND_ORDER:
            sub = lith[lith["litho"] == name]
            if sub.empty:
                continue
            color, shape, fg = LITHOLOGY[name]
            fig.add_trace(go.Bar(
                x=[1.0] * len(sub), y=(sub["top"] + sub["base"]) / 2, width=(sub["base"] - sub["top"]), base=0, orientation="h",
                marker=dict(color=color, line=dict(color="#ffffff", width=0.4), pattern=dict(shape=shape, fgcolor=fg, size=5, solidity=0.35)),
                name=name, legendgroup=name, showlegend=showlegend, xaxis=xaxis, yaxis=yaxis,
                customdata=np.stack([sub["top"], sub["base"], sub["description"]], axis=-1),
                hovertemplate="<b>%{customdata[2]}</b><br>%{customdata[0]:.1f}–%{customdata[1]:.1f} m<extra>" + name + "</extra>"))

    lith_bars("x5", "y", True)

    def xax(domain, anchor, **kw):
        return {"domain": domain, "anchor": anchor, "showgrid": False, "tickfont": dict(size=10, color=MUTED), **kw}

    OV_R = 0.40
    Y_DOM = [0.09, 0.90]
    axes = dict(
        xaxis=xax([0.035, 0.105], "y"), xaxis2=xax([0.115, 0.185], "y"), xaxis3=xax([0.195, 0.265], "y"),
        xaxis4=xax([0.275, 0.345], "y", type="log"),
        xaxis5=xax([0.355, OV_R], "y", range=[0, 1], showticklabels=False, zeroline=False),
        yaxis=dict(domain=Y_DOM, range=[d_base, d_top], autorange=False, title=dict(text="Depth (m)", font=dict(size=12, color=MUTED)),
                   gridcolor=GRID, anchor="x", tickfont=dict(size=11, color=MUTED)),
    )
    annotations = [dict(text=t, x=x, y=Y_DOM[1] + 0.02, xref="paper", yref="paper", showarrow=False, font=dict(size=11, color=INK), xanchor="center")
                   for t, x in [("GR", 0.07), ("RHOB", 0.15), ("NPHI", 0.23), ("Res", 0.31), ("Lith", 0.378)]]
    shapes, connectors = [], []

    Z0, ZSPAN = 0.44, 0.56
    slot = ZSPAN / 3
    panels = [([round(Z0 + i * slot + 0.035, 3), round(Z0 + i * slot + 0.080, 3)],
               [round(Z0 + i * slot + 0.084, 3), round(Z0 + i * slot + 0.169, 3)]) for i in range(3)]

    for i, (wt, wb) in enumerate(windows):
        accent = ZOOM_ACCENTS[i]
        yax, gr_ax, li_ax = f"y{i + 2}", f"x{6 + 2 * i}", f"x{7 + 2 * i}"
        gr_dom, li_dom = panels[i]
        parent_y = "y" if i == 0 else f"y{i + 1}"
        parent_right = OV_R if i == 0 else panels[i - 1][1][1]
        parent_xspan = (0.035, OV_R) if i == 0 else (panels[i - 1][0][0], panels[i - 1][1][1])
        shapes.append(dict(type="rect", xref="paper", yref=parent_y, x0=parent_xspan[0], x1=parent_xspan[1], y0=wt, y1=wb,
                           fillcolor=hex_to_rgba(accent, 0.12), line=dict(color=accent, width=1, dash="dot"), layer="below"))
        axes[f"yaxis{i + 2}"] = dict(domain=Y_DOM, range=[wb, wt], autorange=False, gridcolor=GRID, anchor=gr_ax, side="left",
                                     tickfont=dict(size=9), color=accent)
        axes[f"xaxis{6 + 2 * i}"] = xax(gr_dom, yax, tickfont=dict(size=8, color=MUTED))
        axes[f"xaxis{7 + 2 * i}"] = xax(li_dom, yax, range=[0, 1], showticklabels=False, zeroline=False)
        zmask = (depth >= wt) & (depth <= wb)
        fig.add_trace(go.Scatter(x=col("GR")[zmask], y=depth[zmask], mode="lines", line=dict(color=GREEN, width=1.2), name=f"GR zoom {i + 1}",
                                 xaxis=gr_ax, yaxis=yax, showlegend=False, hovertemplate="%{x:.1f} gAPI<br>%{y:.1f} m<extra>GR</extra>"))
        lith_bars(li_ax, yax, False)
        annotations.append(dict(text=f"{wt:.0f}–{wb:.0f} m", x=(gr_dom[0] + li_dom[1]) / 2, y=Y_DOM[1] + 0.02, xref="paper", yref="paper",
                                showarrow=False, xanchor="center", font=dict(size=11, color=accent)))
        for d in (wt, wb):
            connectors.append(dict(type="line", xref="paper", yref=[parent_y, yax], x0=parent_right, x1=gr_dom[0], y0=d, y1=d,
                                   line=dict(color=accent, width=1.1, dash="dot")))

    fig.update_layout(**base_layout(margin=dict(l=70, r=15, t=130, b=50), showlegend=True,
                                    legend=dict(orientation="h", x=0.5, xanchor="center", y=0.035, yanchor="top",
                                                title=dict(text="Lithology  "), font=dict(size=12))))
    fig.update_layout(barmode="overlay", bargap=0, annotations=annotations, shapes=shapes, **axes)
    titles(fig, "One well, read at four magnifications",
           "Kennetcook #2 (P-129), Windsor Block, Nova Scotia: gamma ray, bulk density, neutron porosity and resistivity beside the lithology column,<br>"
           "then three nested windows, each on its own depth axis.",
           "Source: Agile Scientific's striplog tutorial data (PETREL LAS export and digitized striplog). Lithology patterns follow the FGDC/USGS convention.",
           source_shift=-28, lift=18)
    save(CHART_NUM, fig, width=1280, height=860)
    # The interactive JSON also carries the multi-axis correlation lines.
    doc = json.loads((OUT / f"static-{CHART_NUM:02d}.json").read_text())
    doc["layout"].setdefault("shapes", []).extend(connectors)
    (OUT / f"static-{CHART_NUM:02d}.json").write_text(json.dumps(doc))
Made with Plotly